Share this
by admin
With all of the recent news (Starsky Partnership, Simple Quote Launch, and $19M in New Funding), our quarterly State of Truckload report was a bit delayed this past quarter. Now that we’ve caught our breath, we’re ready to share what we observed.
Here’s everything you need to know.
Loadsmart’s “State of Truckload” report combines industry leading data sources to help explain what happened in the market during the previous quarter.
Here’s what we’ve observed.
Contents:
Summary
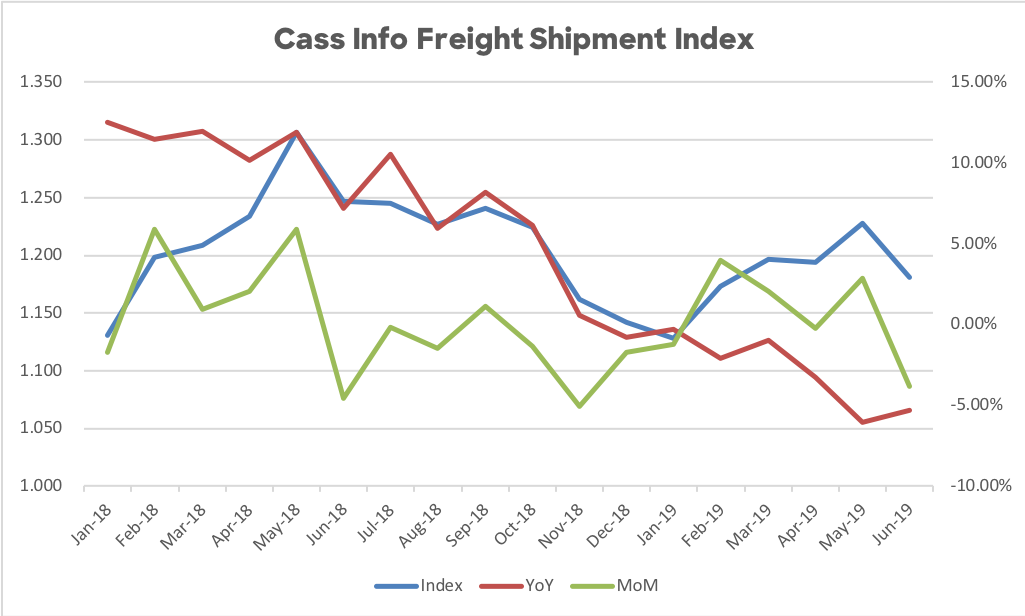
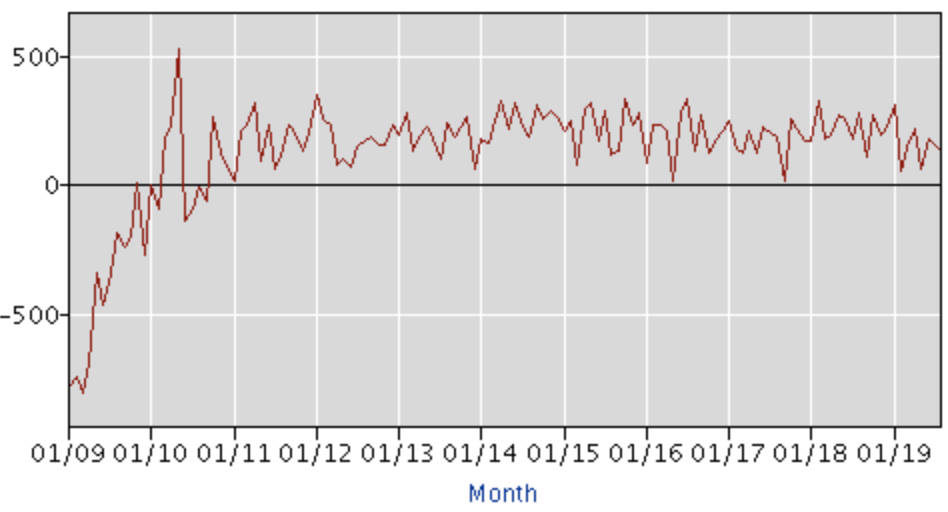
The second quarter of 2019 saw warning signs of a possible economic slowdown shift from theory to reality. Cass Information’s Freight Shipment Index, an index based on $28b in freight volume, has remained negative on a year-over-year basis since December 2018, meaning that as of this past June, monthly freight volumes have been lower than 2018 levels for seven month in a row. That trend has continued in Q3 (more on that shortly).
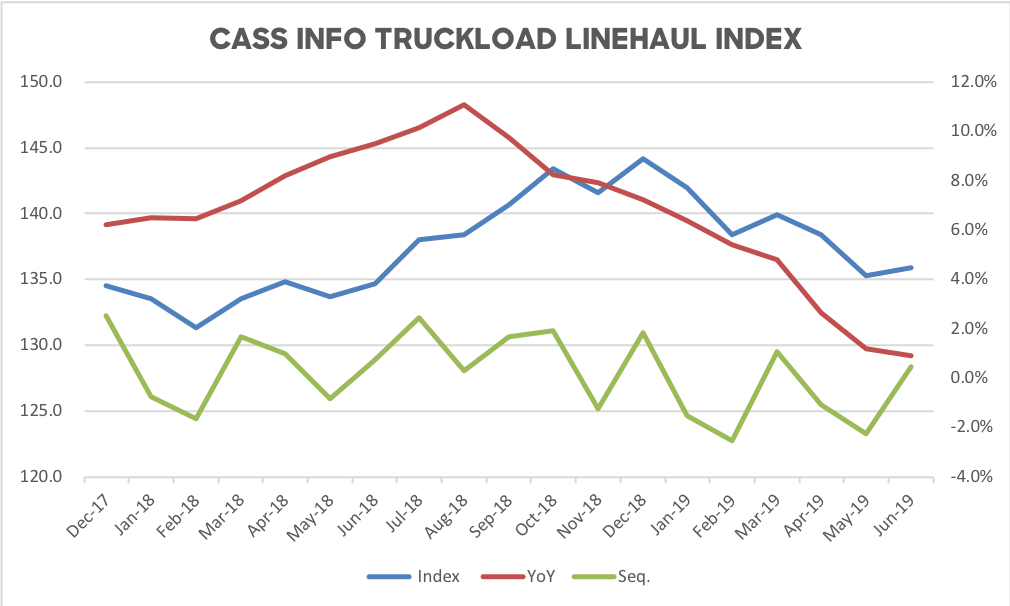
Further, while truckload linehaul rates initially showed minor improvement in March, they fell nearly 3% in the second quarter.
CASS INFO FREIGHT SHIPMENT INDEX
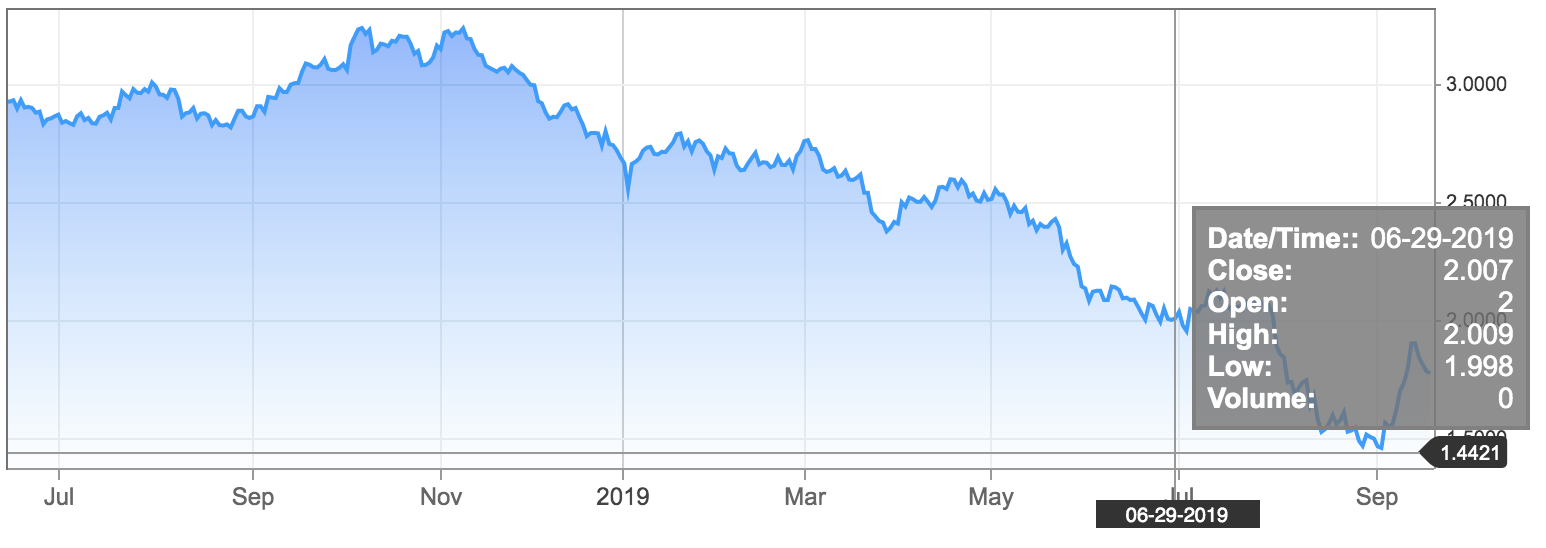
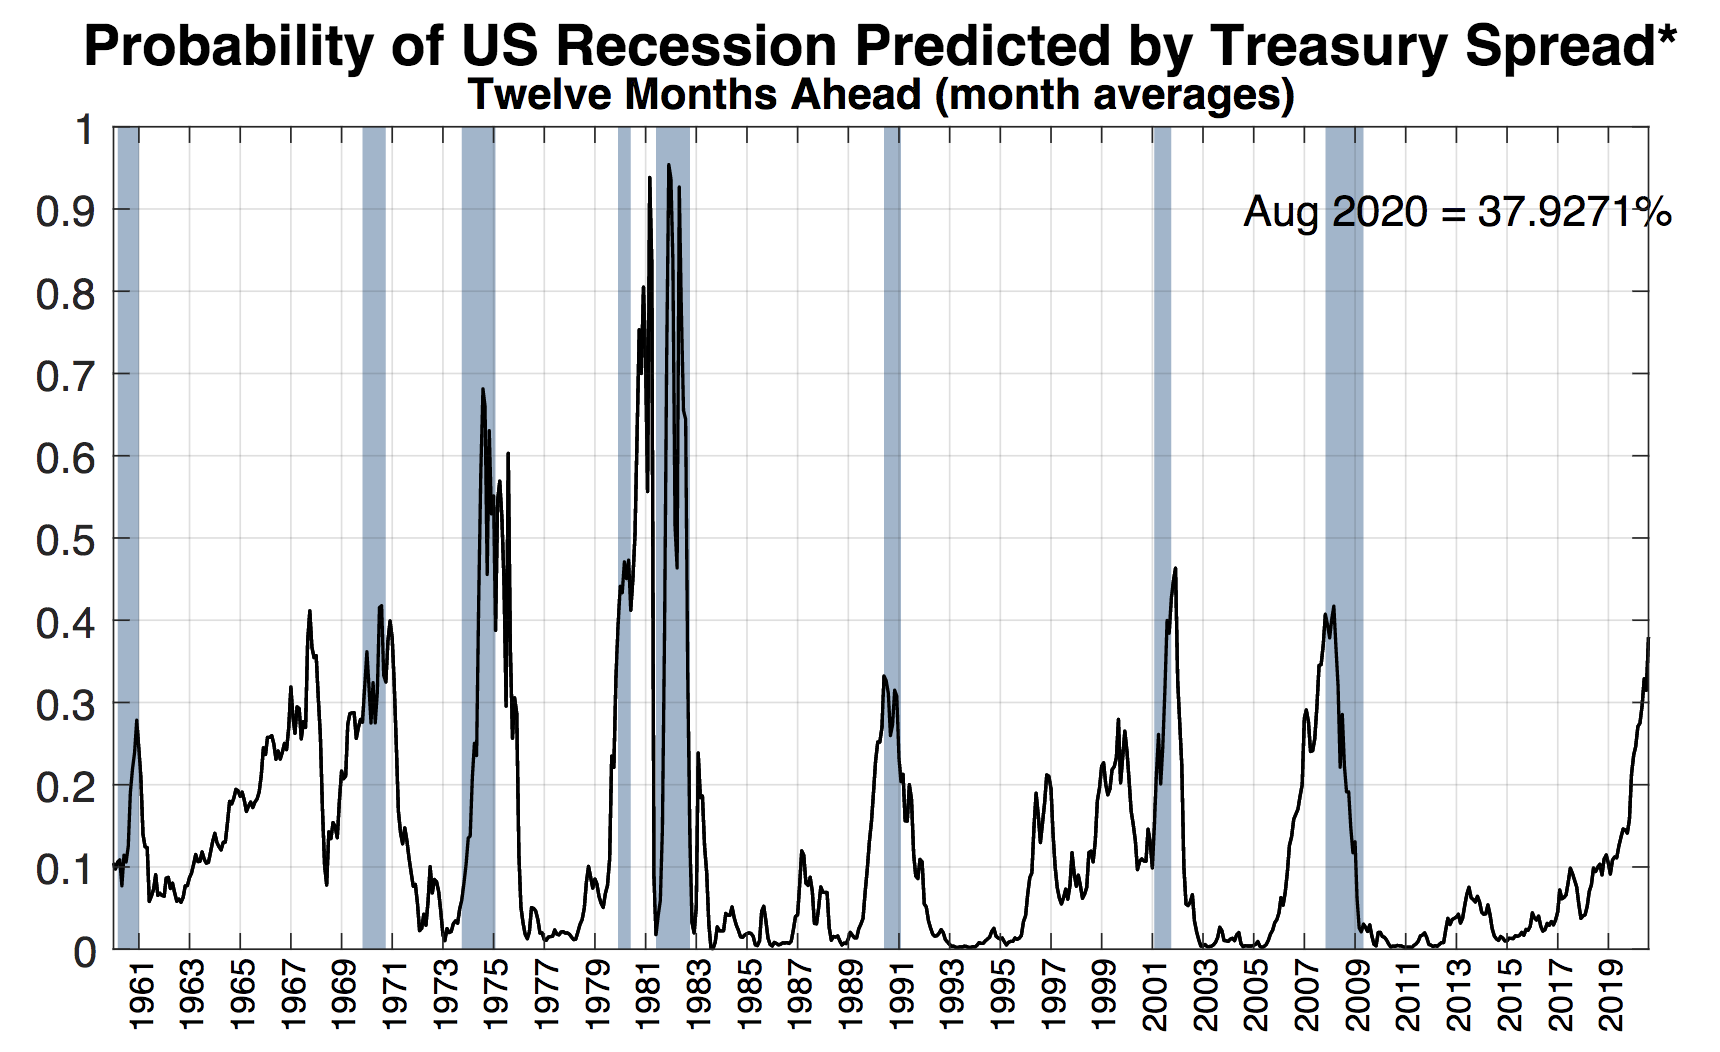
The US economy also offered its own indicators suggesting a potential slow down. After the 10-year Treasury Yield moved back into correction territory at the end of March (2.41% on 3/31/2019), it fell even further in June (2.007% on 6/30/2019). The New York Federal Reserve estimated that the probability of a 2020 recession had risen to 37.9% in August, approaching the 40% level we see saw in 2008-2009.
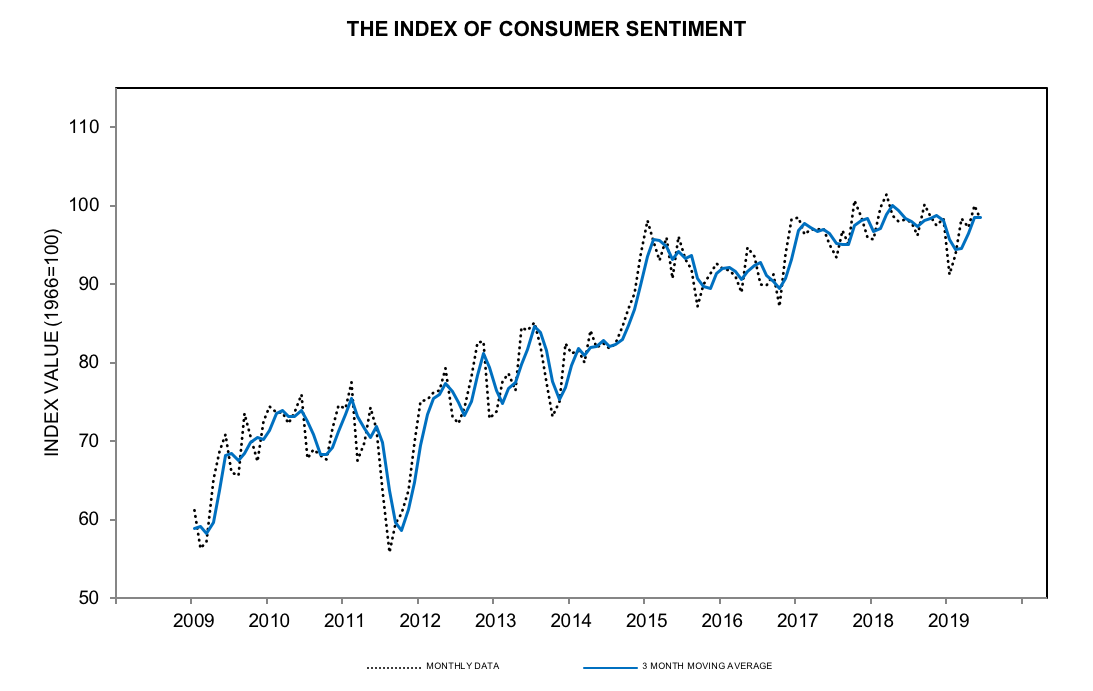
Meanwhile consumer sentiment continued to strengthen, hitting 98.2 in June. The jobs report, after giving a scare in May (62,000 jobs), posted 178,000 new jobs in June, hovering a bit below its 102-month average.
CONSUMER SENTIMENT INDEX
It’s important to note — these trends have not happened in a vacuum. The tariffs and continuing trade war with China have taken their toll on the markets and added an extra headwind for Q3.
The net-net? Q1 indicators showed a slowdown compared to last year and hinted at the possibility of upcoming economic contraction. Q2 signals have all but confirmed that an economic contract is on the horizon.
GLASS HALF FULL:
- Freight volume, while lower than the blockbuster levels of 2018, has shown relatively consistent month over month growth
- Consumer Sentiment for June reached 98.2 and either matched or exceed 2018 levels for May and June
GLASS HALF EMPTY:
Economic contraction is on the horizon
- Freight volume has been down on a YoY basis for seven consecutive months
- Total construction spending remained below 2018 levels for the entire second quarter
- YoY growth for truckload linehaul rates has continued slowing since mid-2018. June 2019 was only 0.9% more than June 2018.
- 10-year Treasury Yield has fallen back into correction territory
- Probability of a recession in 2020 has risen to its highest level since 2008-2009. Again.
Capacity
TRUCKLOAD CAPACITY CONTRACTS IN Q2 2019
Q2 2019 saw capacity begin to “rightsize” relative to decreasing shipment volumes and lower linehaul rates. Sadly, this has resulted in a number of trucking companies going out of business.
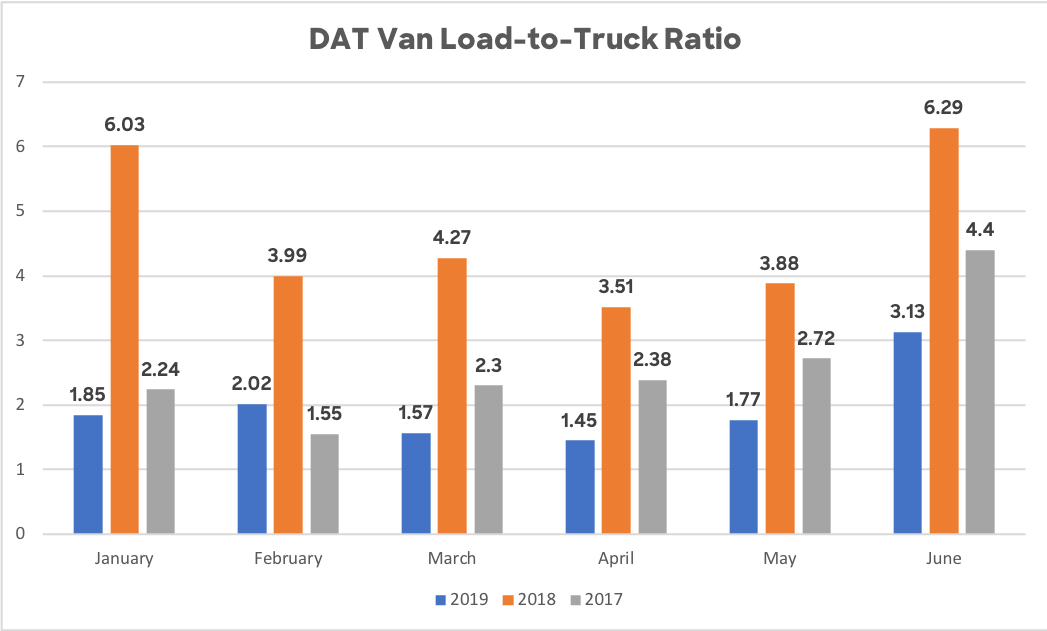
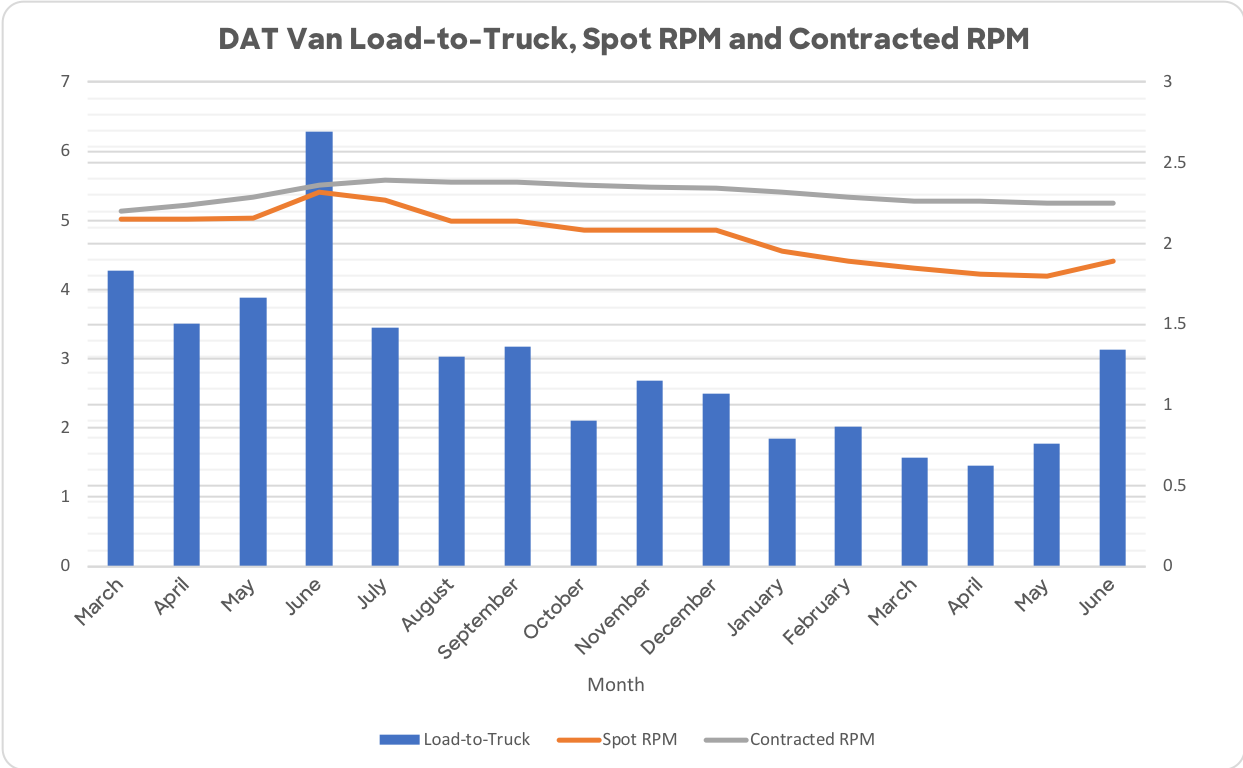
DRY VAN
DAT’s Van Load to Truck ratio hovered between 1.45 and 3.13 loads per truck from April to June, a sharp difference from just a year ago when the ratio was between 3.51 and 6.29 loads per truck. The 2019 LTR even remained below 2017 levels.
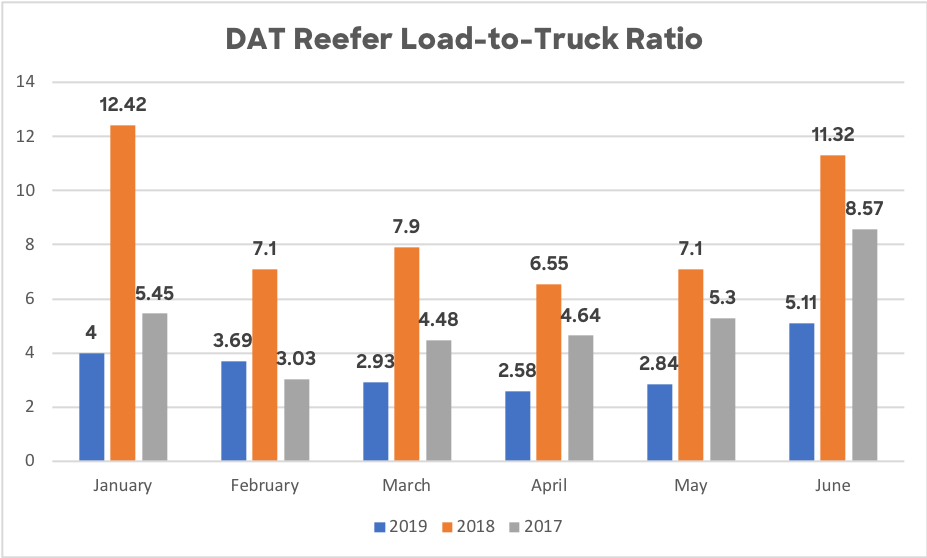
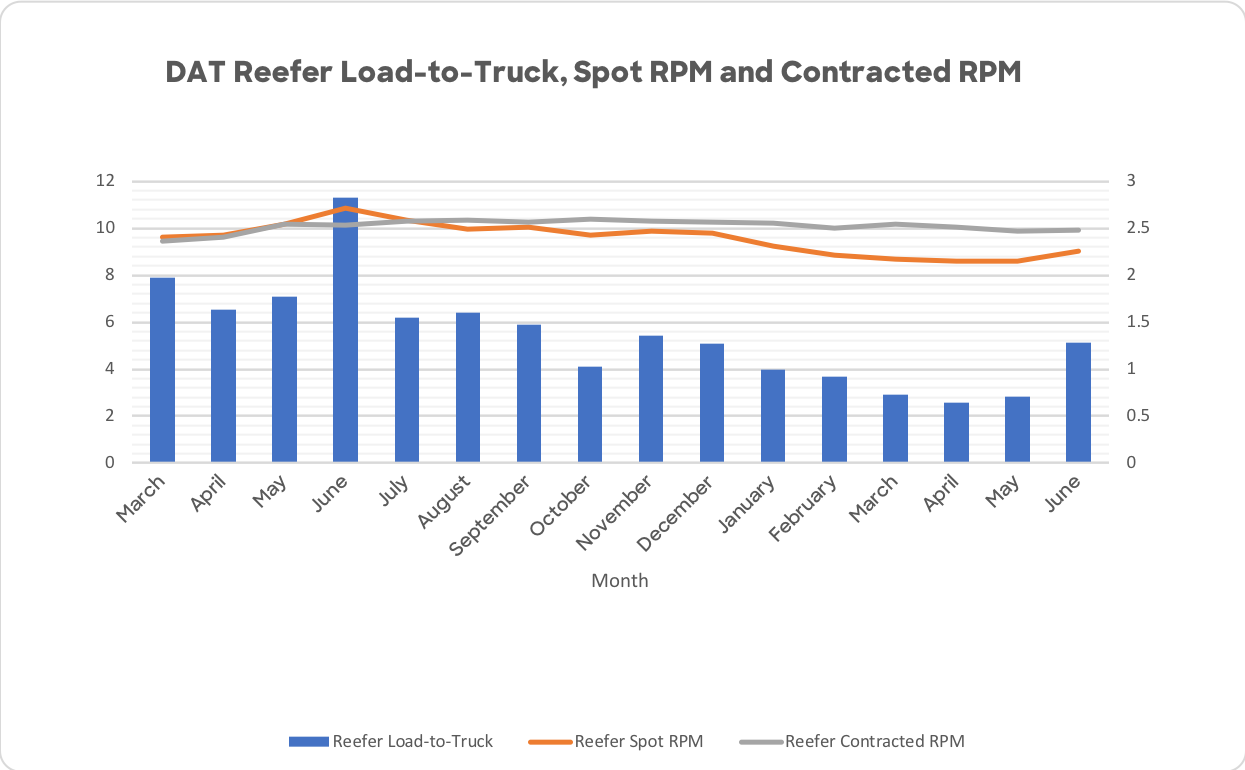
REEFER
The DAT reported that reefer load to truck ratios also remained below 2018 and 2017 levels, hovering between 2.58 – 5.11 loads per truck between April and June. That’s nearly nearly 70-80% lower than 2017 levels and 120-150% lower than 2018 metrics.
Rates
REDUCED SHIPMENT VOLUME AND MARKET UNCERTAINTY CREATE A PERFECT STORM FOR LINEHAUL RATES
According to Cass Information Systems, truckload linehaul rates (without fuel) continued to contract throughout Q2 and June remained just 0.9% above the previous years levels in June.
DRY VAN
In our previous report, we found that van spot rates (including fuel), had been in steady decline since reaching $2.83 per mile in June of 2018. In the second quarter of 2019, spot rates continued to fall in April ($1.81) and May ($1.80), before surging to $1.89 in June. And while rising diesel prices helped spot rates reach their peak in 2018, they have continued to have a decidedly neutral impact in the second quarter.
Contracted rates remained relatively stable throughout Q2, hovering around $2.26 per mile.
REEFER
Reefer rates followed a somewhat similar trend to dry van. Spot prices declined in April ($2.15) and May ($2.15) before surging in June ($2.26). Contracted rates fell roughly 2.4% from March, landing at $2.48 in June.
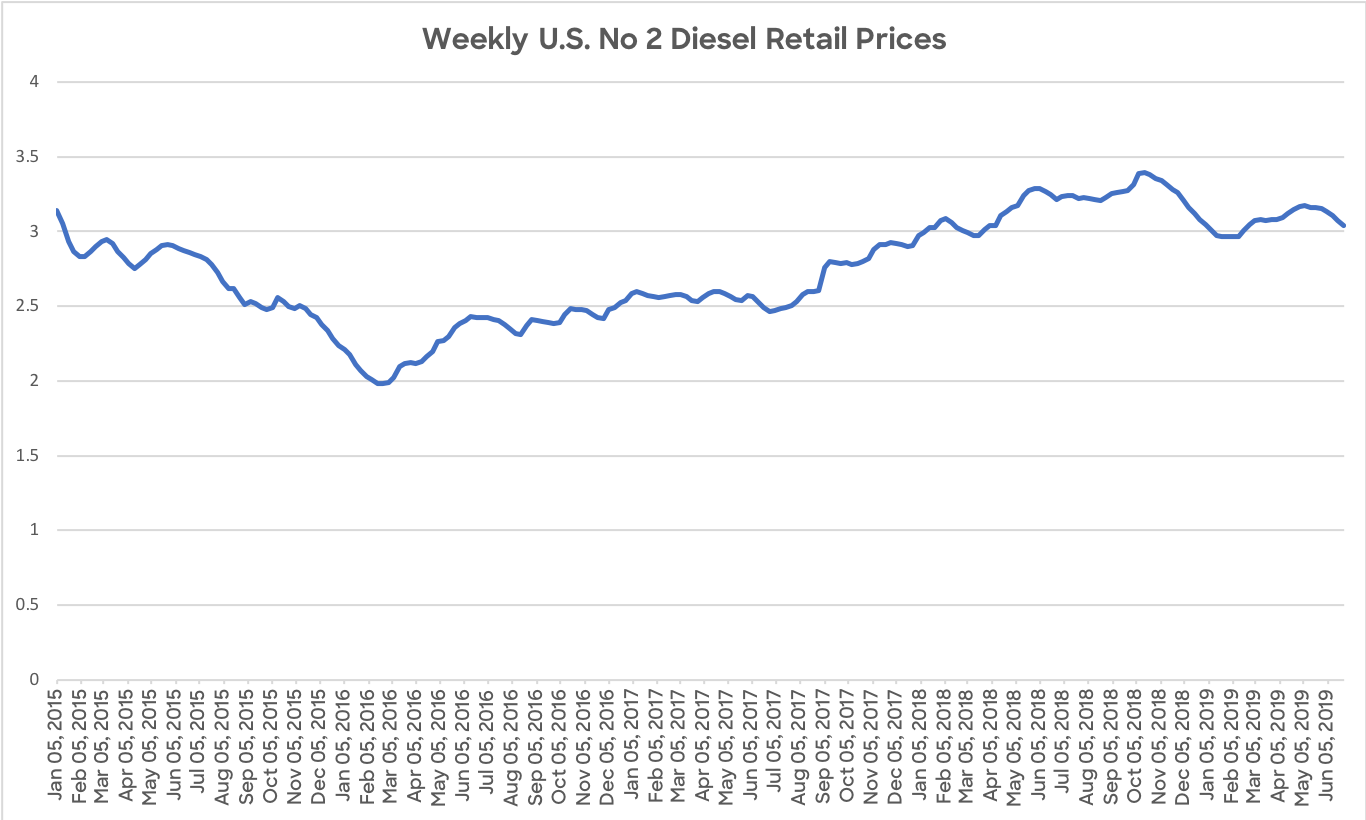
Fuel
DIESEL PRICES INCREASE IN SECOND QUARTER, REMAIN BELOW 2018 PEAK
The price of diesel remained relatively consistent in Q2 2019, hovering between $3.16 and $3.09 per gallon. This represents a 2.5-3.5% increase over Q1.
Wrapping Up
With year over year freight volume declining for the seventh consecutive month, in addition to other economic indicators like the falling 10-year Treasury Yield, it’s relatively certain that we are on the edge of economic contraction. As such, elevated concern and planning for economic for 2020 is warranted.
How Loadsmart Can Help
Loadsmart can help you take advantage of favorable market conditions by inserting real time rates alongside the static prices in your routing guide. This is made possible via direct integration with your TMS. In today’s market, there’s a 15 – 20% gap between spot and contracted rates — savings which can be captured with Dynamic Routing.
Ready to Learn More?
Contact us at sales@loadsmart.com or (646) 887 6278. We look forward to working with you.
Materials in this presentation may contain information about Loadsmart Inc.’s future plans and prospects that constitute forward-looking statements for purposes of the safe harbor provisions under the Private Securities Litigation Reform Act of 1995. Included in forward looking statements are statements such as:
- Statements regarding market trends in the U.S. freight industry, including freight volume and pricing, market size and the state of transportation management systems;
Some forward-looking statements can also be identified by terminology such as “may,” “will,” “could,” “should,” “anticipate,” “believe,” “contemplate,” “estimate,” “expect,” “intend,” “plan,” “predict,” “project,” or similar words.
Such forward-looking statements are based on our current expectations and involve inherent risks and uncertainties, including factors that could delay, divert or change such statements, and could cause actual outcomes and results to differ materially from our current expectations. No forward-looking statement can be guaranteed. In evaluating forward-looking statements or forward-looking information, we caution readers not to place undue reliance on any forward-looking statement, and readers should specifically consider the various factors which could cause actual events or results to differ materially from those indicated by such forward-looking statements.
In addition, any information contained in this presentation was current as of the date presented and should not be relied upon as representing our estimates as of any subsequent date. While we may elect to update forward-looking statements at some point in the future, we specifically disclaim any obligation to do so, even if our estimates change, whether as a result of new information, future events or otherwise. Consequently, readers should not rely upon the information as current or accurate after the presentation date.