Share this
by aaronroseman
Welcome to August’s Episode of Loadsmart First Look. This is a monthly series that dives into the domestic freight market, the economy as a backdrop to the trucking industry, and the latest developments and technologies that are changing the supply chain.
This month, with an increasingly confounding market, our VP of Operations, Jim Nicholson, brought in a little help from Supply Chain Expert Mark Montague:
What’s going on in the market?
Jim: It’s been an absolutely fascinating year to study the freight markets. I’m curious to see what you’re seeing and trends and data points you’re looking at.
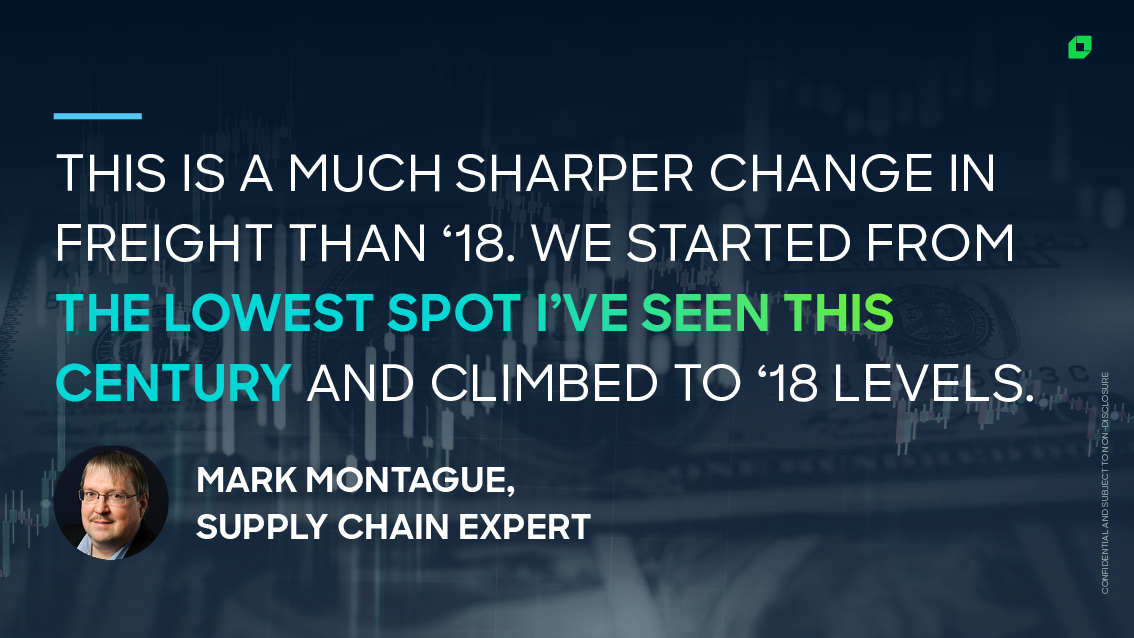
Mark: When you think about supply chain disruption or changes, 2017 comes to mind, which culminated in the ELD mandate and then elevated rates throughout 2018. There was quite a run up rate in [2018]. Recently, I pulled the data to look and see – how does this compare and this is actually a much sharper change in the freight marketplace. For one thing, we started from the lowest spot that I’ve seen in really the last century as far as freight rates and now we’ve climbed to some rates that are in some cases comparable to those 2018 rate levels.
Jim: This is a little but different, right? With the COVID pandemic there’s quite a bit more uncertainty and more volatility of the ups and downs. What are some changes you think might be contributing to what we saw in 2017 vs. what we see right now?
Mark: We had the economy totally shut down for about six week – so for most of April. March ended up strong because of all the rush to go to the grocery stores and get supplies even as food service was shutting down. And you had other industries, auto makers, a lot manufacturers shut down for the month of April and really for the first part of May.
And that was really the nadir, the lowest point was mid to late May when a lot of stuff had ground to a halt and we started to see some freight start to come back. Produce season kicked in in May so for refrigerated freight April was really the low point.
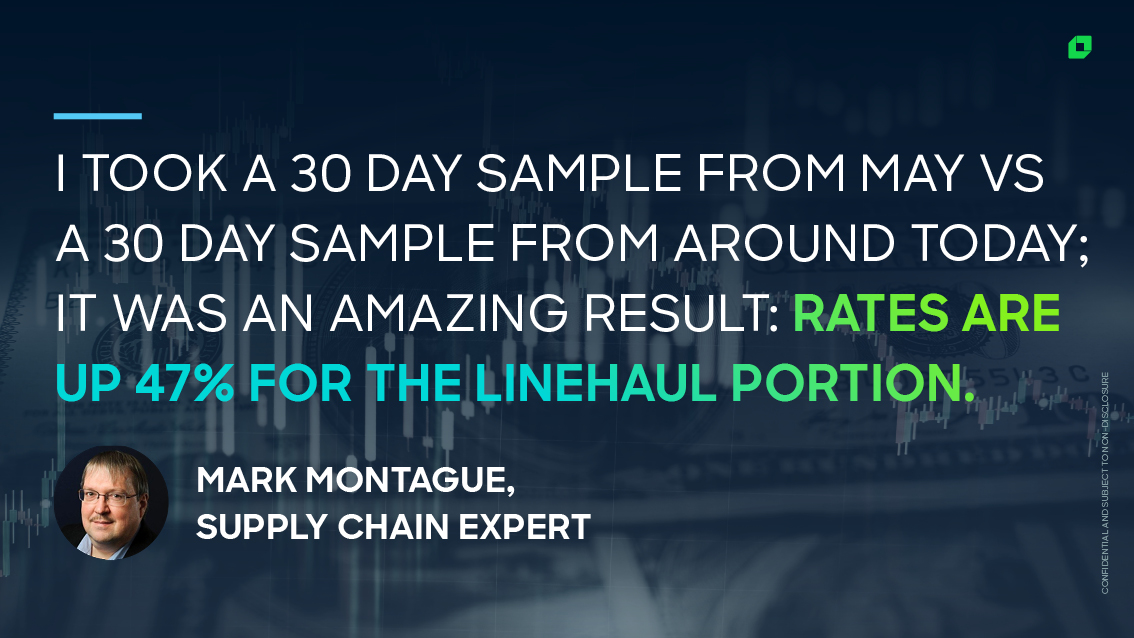
But flatbed and van really hit their lowest rates in the month of May. I actually captured a RateView file front that month, RateView being the DAT product that tracks freight rates, and I took that 30 day sample versus a 30 day sample from around today, it was an amazing result: rates are up 47% for the linehaul portion of the van haul rate in really a 2.5 month time frame. One of the things I also looked at – well what happened with volumes? Well volumes are 15.5%, so it’s a real increase.
As far as what’s driving it, that’s been a big question on a lot of analyst minds. I get to talk to some analysts on a fairly regular basis and it partly is the spot market benefits whenever there’s disruption. That probably gets into another question that you have.
What’s happening with contract rates?
Jim: Yeah, that’s a perfect segway, because there are a lot of questions about what’s happening with the inflection rate in contracted rates.
Mark: We’re starting to see contracted van rates rise. The first indicator was in July and normally there’s a slump in freight post July 4th and that did not happen at all this year. The contract rates are up again in August after a slight rise in July.
Flatbed rates on the contract side never really took much of a dip, but they’re starting to rise a little bit now in August. The oil and gas industry which drives a lot of flatbed business in the state of Texas and anywhere there’s oil production is a big part of freight that’s missing in the flatbed arena and now we’re starting to see some contract rate increase on the flatbed side.

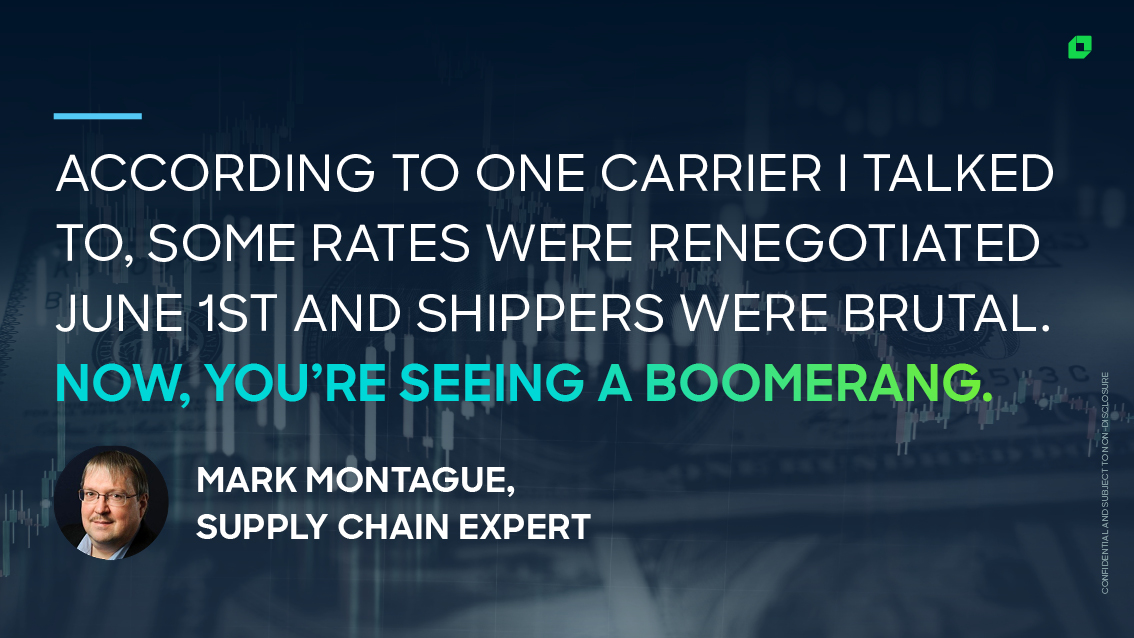
Interestingly enough though contract rates on the reefer segment are down in August. That is really a juxtaposition versus what’s happened in the spot market where the reefer rates were the first to rise in the spot market starting in May. That was driven by strong produce out of California. But according to one carrier I talked to, a lot of those rates were negotiated in that May-June period, say Jun 1st and the shippers were pretty brutal on the carriers during that time period and now you’ve seen a boomerang. So you’ll see recovery on contract rates throughout the Fall.
Jim: Going back to 2017, 2018 is there anything we can learn about how contracted rates followed the disruptions in the marketplace?
Mark: One of the things I looked at was the correlation between spot market rate change and contract rate changes. And it can be from anywhere 2 – 6 months out. A lot of contracts are 1 year contracts. A lot of contracts now are also evergreen or ‘hey we’re going to talk quarterly.’ It’s hard to hold contract rates solid for a year because either things are going up and carriers feel they’re shortchanged or things are are going down and shippers feel they’re paying too much
Jim: We’ve seen and I think 3PLs they follow that I think the carriers being there and the 3PLS follow. So on the 3PL the contract has been difficult or challenging as margins are compressed.
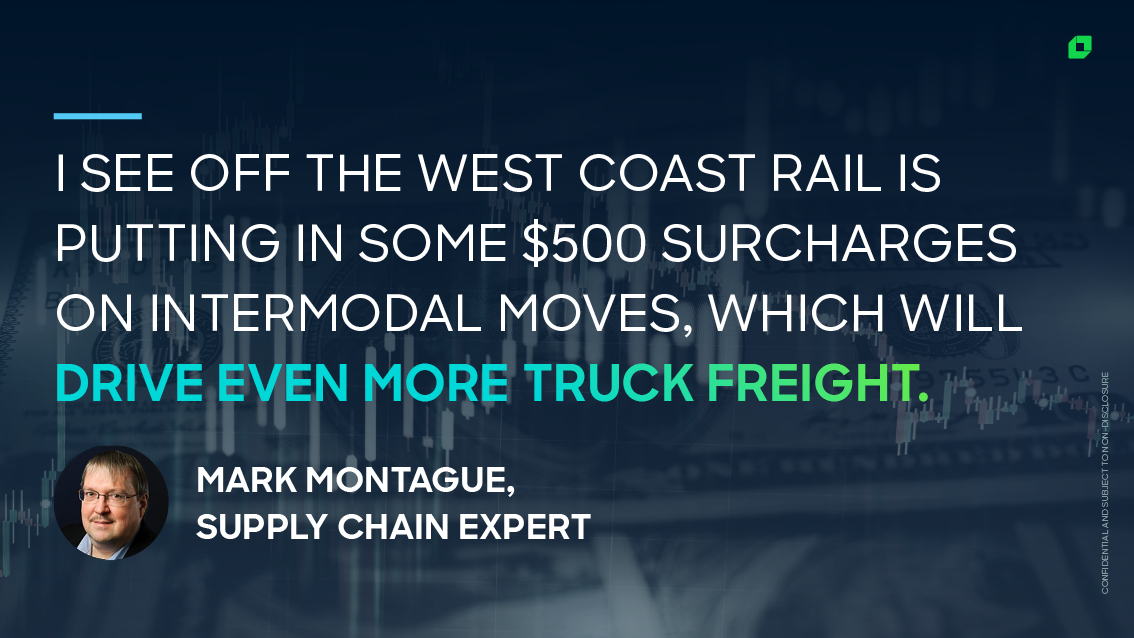
Mark: June is when it really became apparent that the spot market was coming back strong and in August you’re already seeing it in van and a little bit in flatbed. The other thing I used to track is rail intermodal. The rails obviously track van spot and change their pricing accordingly. And I see off the West Coast they’re actually putting in some $500 surcharges on those intermodal moves, which will just drive more truck freight.
How is the market positioned to handle retail season?
Jim: Imports through the West Coast seem to continue to be strong, which to most of would paint a picture that this will continue off the West Coast as we get closer into this retail season.
Mark: When I look at a lane by lane basis the thing that shouted out was that overwhelmingly anything coming out of LA has really jumped in the forefront as far as price changes and volumes. I just have a couple of example lanes: the number 1 lane in dollars was Los Angeles to Dallas and on that particular lane rates jumped from a linehaul of 1.22 – 2.64 so that’s a 116.4% rate increase.
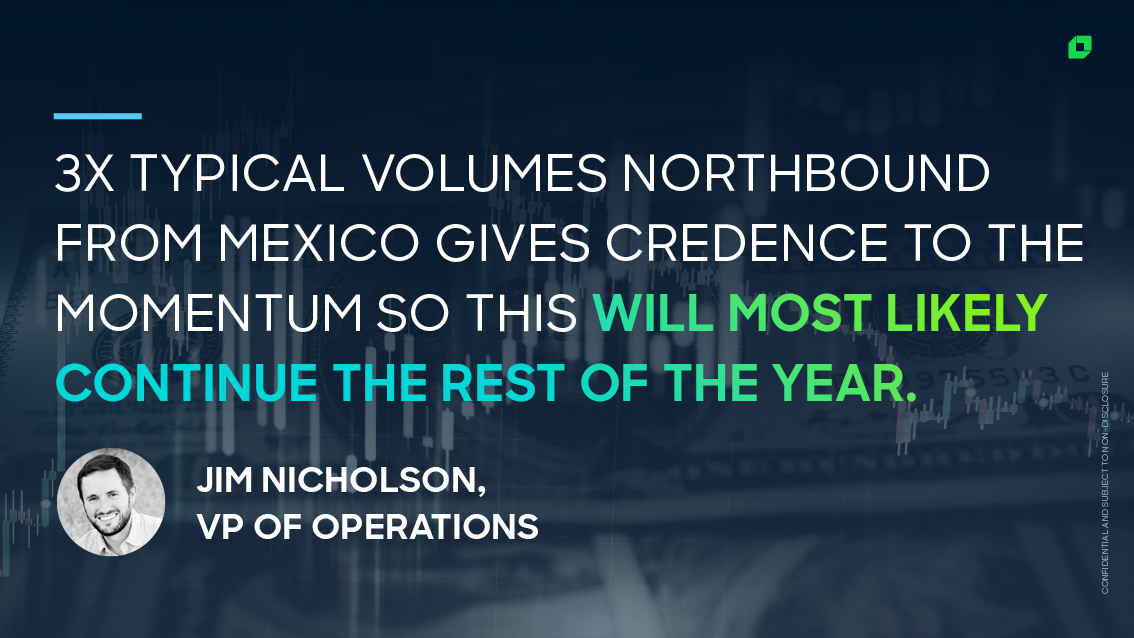
Jim: Looking northbound from Mexico there is an enormous amount of demand, almost 3x the typically volumes we’ve seen the last few years which also gives some credence to the momentum that this will most likely continue throughout the rest of the year if you combine the imports of the West Coast with what’s being pushed through the Southern Border from Mexico.
Mark: Interesting enough, and I don’t often see these lanes in the top 100 but I noticed some lanes out of El Paso going up into the MidWest and other parts of the country that made that list. Dallas definitely showed up, Texas in general showed up as the second biggest driver after California.
Stay Up to Date
With all the latest weekly and monthly market insights on our Youtube page. Questions about anything you saw? Email sales@loadsmart.com and let’s talk about how we can help you take advantage of real-time market conditions.