Share this
by aaronroseman
Spot rates in the full truckload market are essentially commoditized, causing spot rates to be an important source of systematic risk for all participants in the industry (carriers, shippers, brokerages, etc.). The ability to accurately estimate this systematic risk (i.e. volatility) for the truckload market is challenging due to inherent complexities embedded in the price of fuel, labor conditions, technological changes, macro-economic environment and the seasonality of industrial production and retail sales.
Unsurprisingly, modeling and predicting volatility has a great importance in the market: if shippers can predict and benchmark freight volatility, they can optimize lane selection and avoid overspending, resulting in a more sustainable supply chain network.
The objective of this analysis is to present Loadsmart’s dynamic approach to predict freight spot market volatility using GARCH modeling, an advanced technique used in financial econometrics. We also intend to show how this prediction of volatility will enable Loadsmart to help shippers (a) benchmark the risk embedded in their freight spend and (b) to determine the acceptable levels of price variation within their network in the short- and long-term.
Estimating volatility:
Generate a daily rate index:
To predict spot rate volatility, we first had to generate a daily spot rate index that we could analyze directly. Truckload spot market rates can be represented by an index generated from the top 10 most relevant key market areas in the US in terms of freight volume.
Generating this index ━ Figure 1a ━ required a two-stage procedure: (1) a data cleaning process, which included defining the most important lanes that originate from each major area and (2) an average of all lane rates on a daily basis from November, 2016 to May, 2022. All in all, this index comprises 875 unique lanes. To properly assess volatility, we also generated a chart that views daily market variation ━ Figure 1b.
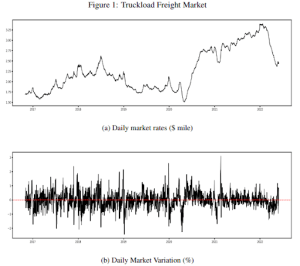
We observed that the daily pricing index has significant “serial correlation” (a concept popularly found in financial market analysis), meaning that a shipper or carrier may alter their behavior in a non-random way depending on how the rates evolve. We also found truckload rates to exhibit non-constant volatility over time, which helps explain the behavior for the daily market variations and distinct periods of high and low volatility.
Applying the GARCH Methodology:
Without going into too much detail, the GARCH (Generalized Auto Regressive Conditional Heteroskedasticity) methodology provides a useful framework for assessing truckload price volatility due to the statistical dynamics of daily market variations (Figure 1b above). The main results/conclusions drawn from applying this methodology on the full truckload spot market included:
- The market generally presents weak sensitivity to new information, probably due to the large number of competing carriers;
- Estimated long-run (annualized) volatility of 5.42% (i.e. prices vary yearly by 5-6% on average);
- Volatility persistence of about 2 weeks (i.e. today’s market volatility will influence future volatility for up to 2 weeks);
- Volatility tends to revert to its average level over time.
Empirical implications and conclusion:
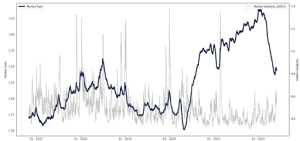
- In Figure 2 below we plot the GARCH volatility output along with the spot rate index. Volatility (unsurprisingly) tends to spike around unusual nation-wide events, such as the Polar Vortexes in the winters of 2019 and 2021, and often at the end of the year as well.
Figure 2: Daily Market volatility
- Leveraging a volatility output such as this can enable shippers to select the best market to move a load (especially since we can create this same measurement on the lane level). As many of us know, over periods of high volatility, shippers should avoid the spot market and opt for contract agreements in order to avoid finance risk exposure
- Ignoring specific situations, the implications of these results overall indicate that the truckload market is actually a stable environment and good for long-term investments. In other words, growth should be focused on the contract market which supports how many shippers already attempt to distribute more of their freight spend on contracted freight.
Finally, we’d like to summarize how shippers can benefit from leveraging this risk model:
- Understand how to measure of risk in the freight market, which is critical for smart business planning;
- Use market volatility as a benchmark to identify market opportunities at the lane level, specifically in periods of market shifts (know when to move a load on either the spot or contract market);
- This could act as a proxy for discount rate for valuation of contracts;
- Determine the acceptable/reasonable levels of price variation in the short- and long-term for your network or by lane. This can assist with price negotiation, reviewing your costs, assessing floating rate contract structures, and much more
If you have questions, thoughts you’d like to share, or would like more information on how Loadsmart can help measure volatility for your freight network, please reach out to jonathan.payne@loadsmart.com and max.resende@loadsmart.com