Share this
by aaronroseman
July’s freight market movements went mostly as expected. Spot rates declined MoM given soft freight demand and excess capacity and contract rates began their decline – a decline that we expect to continue to see over the coming 4-6 months as they catch up to low spot rates.
As usual, in this Monthly Market Update, we will (a) provide an update / analysis of the full truckload market and (b) present some compelling trucking-related economic data and analysis to provide a macroeconomic view on the state of the market.
We hope you enjoy! #movemorewithless
Full Truckload Market Overview
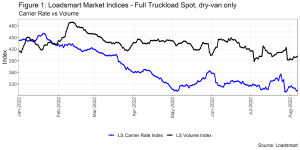
Figure 1
- Volumes: our average volume index is down by 7% MoM. After hitting a new YTD bottom on July 4th, the index recovered traction again till mid-July, when the downward trend resumed.
- Rates: in the first half of July, our price index plunged, reaching a level near the yearly low. In the second half, the index had a brief recovery led by Southern California’s (Los Angeles and Ontario) heated demand. Sonar’s OTRI for the region displayed a similar bounce since demand, and hence, prices soared amidst an increase in port activity. In the last week of the month, SoCal prices normalized and the index returned to its beginning of the month levels.
Suggestions for shippers:
- With national rejections (measured by Sonar’s OTRI) sitting at ~6.3% (the lowest point in over 2 years), shippers are in the driver’s seat. If you need/want to move freight on the spot market, it should be easy to find capacity and you can push rates as much as 10-15% below even in current market conditions. Carriers need freight.
- As mentioned in our last monthly, remember to keep driving contract rates down as they still have a 20%+ gap from spot rates.
- According to DAT’s National DRV spot & contract indices, contract rates have begun their descent: from June > July, National DRV contract rates were down 4 cents, and so far, in August, they’re down 14 cents.
- Contract rates are dropping much faster than spot rates, which only have dropped 4 cents from July > August
- If you want to recognize cost savings as the market softens but do not want to constantly re-bid your network, consider leveraging Loadsmart’s Reliable Contract Solution – click here to read more
- According to DAT’s National DRV spot & contract indices, contract rates have begun their descent: from June > July, National DRV contract rates were down 4 cents, and so far, in August, they’re down 14 cents.
What is Loadsmart expecting for August and what are we watching closely?
- We expect contract rates to continue their somewhat rapid decline (5%+ in August) as well as minor spot rate reductions (1-3%). August is historically soft, and we do not see anything that would indicate a tightening over the coming weeks
- We know there is an excess of capacity in the market today, so Loadsmart is focused on demand indicators in August: import volumes, consumer demand, and overall freight demand. These have all been bearish recently and will be key for understanding what kind of peak season impact we could expect for September and October.
Freight & Economics
Diesel prices
- After six months of consecutive increases, diesel prices began to drop in July, declining 5% MoM, as shown in Figure 2.
- The upward trend in diesel prices started in Dec/2021 when the oil production could not meet the post-pandemic resurging demand as offices and industries began reopening.
- In March, a supply issue was added to the mix when the U.S. imposed sanctions on Russian oil and diesel prices peaked in June costing $5.75/gallon – shown in Figure 2.
- Figure 2 plots the (Producers Price Index) PPI for freight trucking, which measures the average monthly change in the amount received for trucking services.
- The PPI is highly tied to diesel price, but comparing the two series historical volatility since 2007, we notice that the first is 50% less volatile than the latter, which shows how the carrier market’s can struggle in fuel prices hike cycles, such as the current one. Given their market competitiveness, carriers are unable to pass-through a great share of the fuel price hikes to their customers.
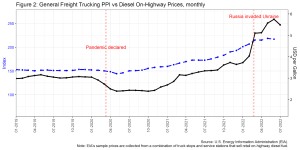
Figure 2
- The same conclusion is drawn more explicitly from our internal data. In Figure 3, we display the average share of fuel surcharge levied on a carrier’ base rate. Since mid-2019 there were two external shocks that jolted this series, dividing it into three periods.
- In the pre-pandemic period, the average share of the rate taken by fuel surcharge was around 11% of the base rate. During the two years of covid restrictions, the rate fell to only 6%, and; after the Russian-Ukraine war began, it rebounded reaching a historical high of 17%.
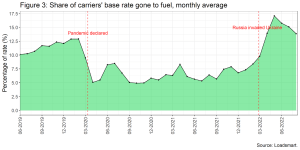
Figure 3
- But if freight demand remains stable at current levels, we expect the share of fuel surcharge on rates to continue to drop as diesel prices are currently in a downward trend.
- Recent forecasts from EIA suggest that, indeed, the oil supercycle is over and diesel prices should stabilize at lower levels in the fourth quarter of 2022 – Figure 4.
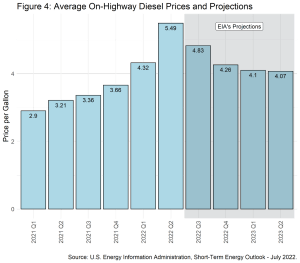
Figure 4
Transborder Flows
- North American transborder freight was up 28.3% in May YoY, according to the Bureau of Transportation Statistics. Trucks were responsible for 59% of these transborder flows, moving US$82 bn in the same month (a 15.7% rise YoY) – see Figure 5. The top traded commodities were: (i) computers and parts ($15 bn); (ii) electrical machinery ($12 bn); (iii) vehicles and parts ($11 bn).
- By breaking down trucking flow values we notice that most of this increase in transborder freight volume was brought by the rise in imports from Mexico to the U.S – truck freight rose 20.7% in May YoY – as shown in Figure 6.
- Mexican imports had been gradually gaining market share in the U.S. over the last few years as a result of the U.S. and China trade war.
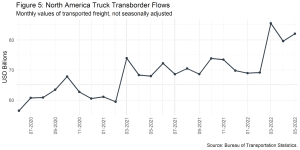
Figure 5
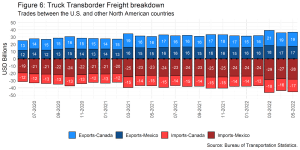
Figure 6
Please reach out to Jon Payne (jonathan.payne@loadsmart.com) with any questions, suggestions, thoughts, etc. Thank you!