Share this
by jpallmerine
August’s freight market showed much of the same as the past few months with actually some additional softening overall according to our indices. Due to persistent demand headwinds and an excess of capacity, we expect any seasonal retail surge effect in September to be largely muted.
As usual, in this Monthly Market Update, we will (a) provide a brief update/analysis of the full truckload market and (b) present some compelling trucking-related economic analysis to provide a macroeconomic view on the state of the market.
We hope you enjoy! #movemorewithless
Full Truckload Market Overview
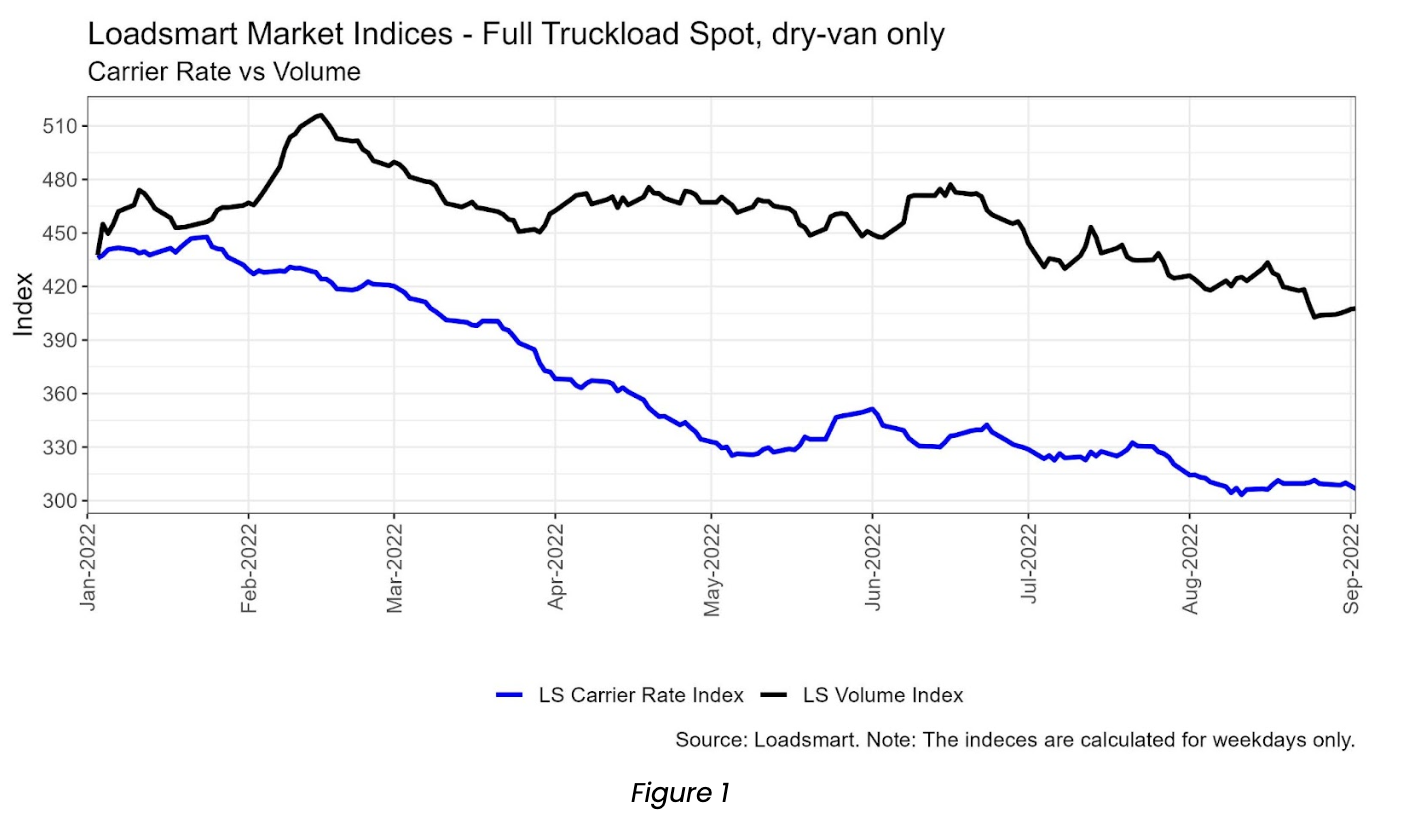
- Volumes: our volume index is down by 5% MoM in August – this decrease wasn’t concentrated across any specific industries and the minor decline looks to be roughly in line with the broader market. This volume decrease signals further demand softening as we would typically see a bounce back in volumes after a softer July.
- Rates: in August our price index remained stable overall (i.e. it finished around where it began), but in the second week, it reached its lowest point in 2022. Additionally, the index was down 5% overall MoM largely due to the 7% drop from the end of July to early August. The additional rate softening in August wasn’t particularly surprising (we actually predicted this in our last month’s market update): volumes softened slightly and capacity remains loose.
Suggestions for shippers:
- Contract rates are continuing their decline as expected (down about 3% MoM according to LS data). The soft market is here to stay for at least another ~6-9 months so be sure to push contract rates down as much as possible amidst the incoming RFP Season.
- If you want to recognize cost savings as the market softens but do not want to constantly re-bid your network (and with 100% PTA), consider leveraging Loadsmart’s Reliable Contract Solution – click here to read more.
- There are mixed reviews on what to expect over the next 2 months as we head into the typical Peak Retail Season.
- Some believe that the significant decline in imports indicates further truckload demand headwinds, while others argue this won’t directly impact truckload demands as much as other key variables like durable goods manufacturing output and homes under construction.
- Regardless of your stance, it’s likely that the market will remain soft over this period so ensure you set your expectations correctly.
- What is Loadsmart expecting for September and what are we watching closely: spot rates have likely hit their floor for 2022, and we expect September to be flat in terms of rates and volumes. Contract rates should begin to speed up their decline downward with another ~5-7% decrease MoM.
Freight & Economics
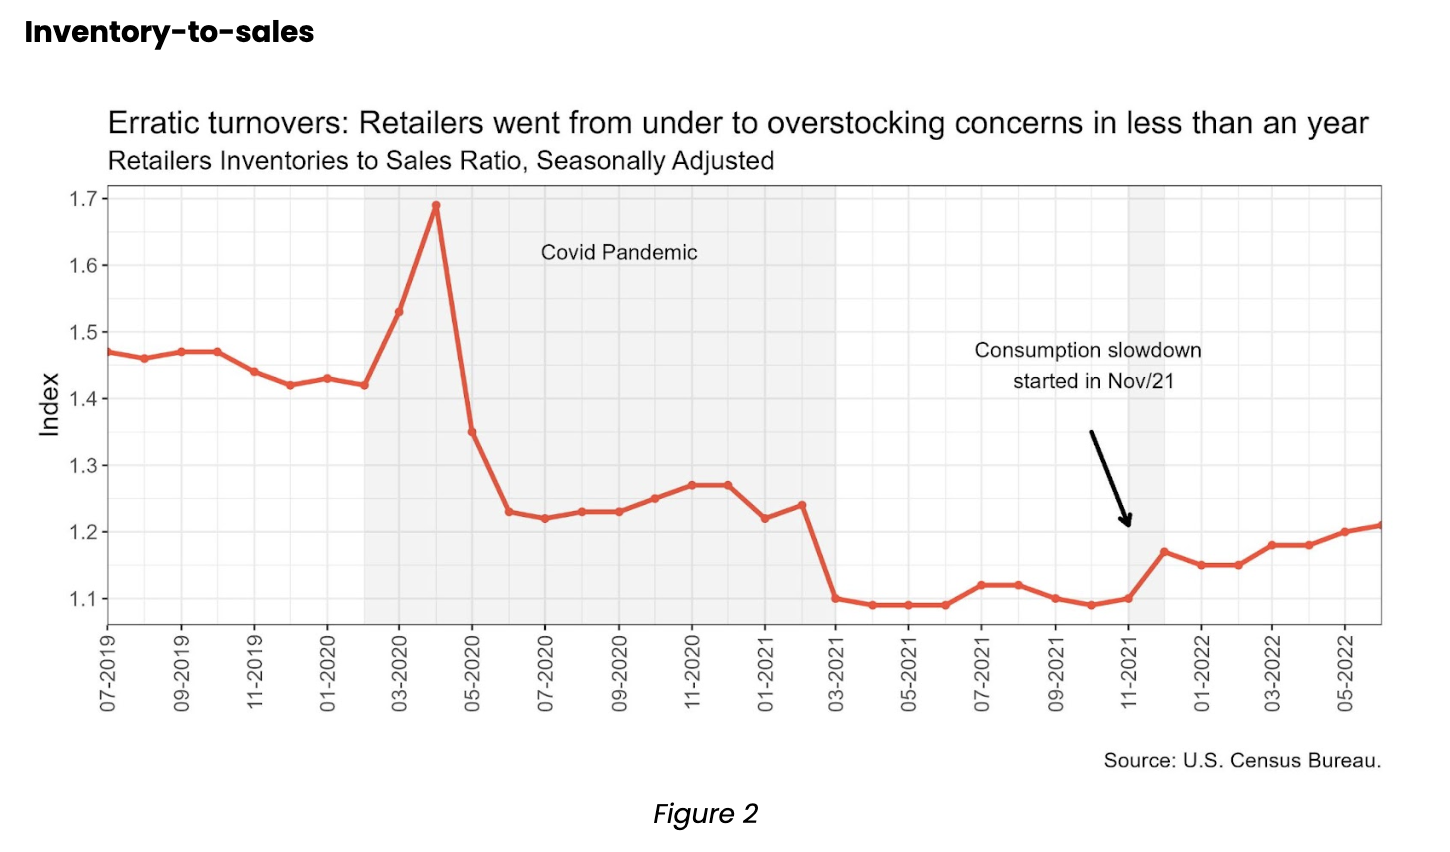
- Retailers’ inventory-to-sales ratio was 1.21 in June; i.e. the inventory surplus was enough to cover for additional 1.21 months of sales. The ratio reached its highest level since Feb/21, when it was at 1.24 – as shown in Figure 2.
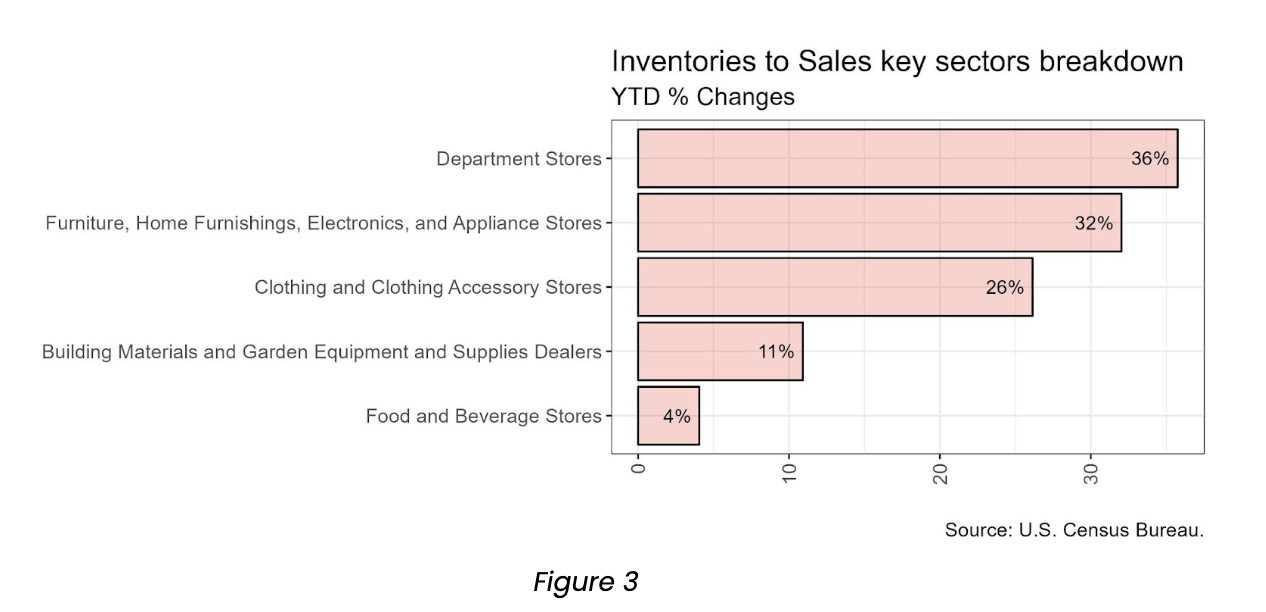
- The increase in inventory-to-sales ratio was mostly brought by consumption slowdown, especially by the weakening in demand for discretionary items. Breaking down the ratio by sectors, we note that department stores and home goods had the highest YTD increases in the ratio (36% and 32%, respectively, Figure 3).
- Additional supply chain disruptions (port congestion, labor shortages, and disputes in the transportation sector) have also contributed to this rise as it is safer to overstock when lead times became less predictable.
- This increase has a direct impact on the freight market – with more inventory in stock, retailers have less of a need for additional freight.
Trucking employment
- The freshly released August jobs report shows that the labor market for trucking remains solid with an employment growth rate of 4.6% in August, 0.7 p.p above the overall nonfarm rate – shown in Figure 4.
- For the warehousing sector, payrolls continued to increase above the overall rate too but at a slower pace. The sector’s YoY rate was 7.0%, down 3.5 p.p. from Apr/22 peak – Figure 4.
- The slowdown in hirings reflects e-commerce retailers’ decisions to delay new warehouse openings and forgo plans of building more plants.
- During the pandemic, online retailers enhanced their strategy to reduce delivery times and shipping costs by expanding their network of distribution facilities and consequently shrinking the length of hauls.
- The strategy’s implementation had direct effects on transportation’s labor market: the number of jobs for warehouse staff and local-haul drivers grew far more than the overall nonfarm payroll. This phenomenon was known as the “Amazon effect”, as it was led by the e-commerce giant.
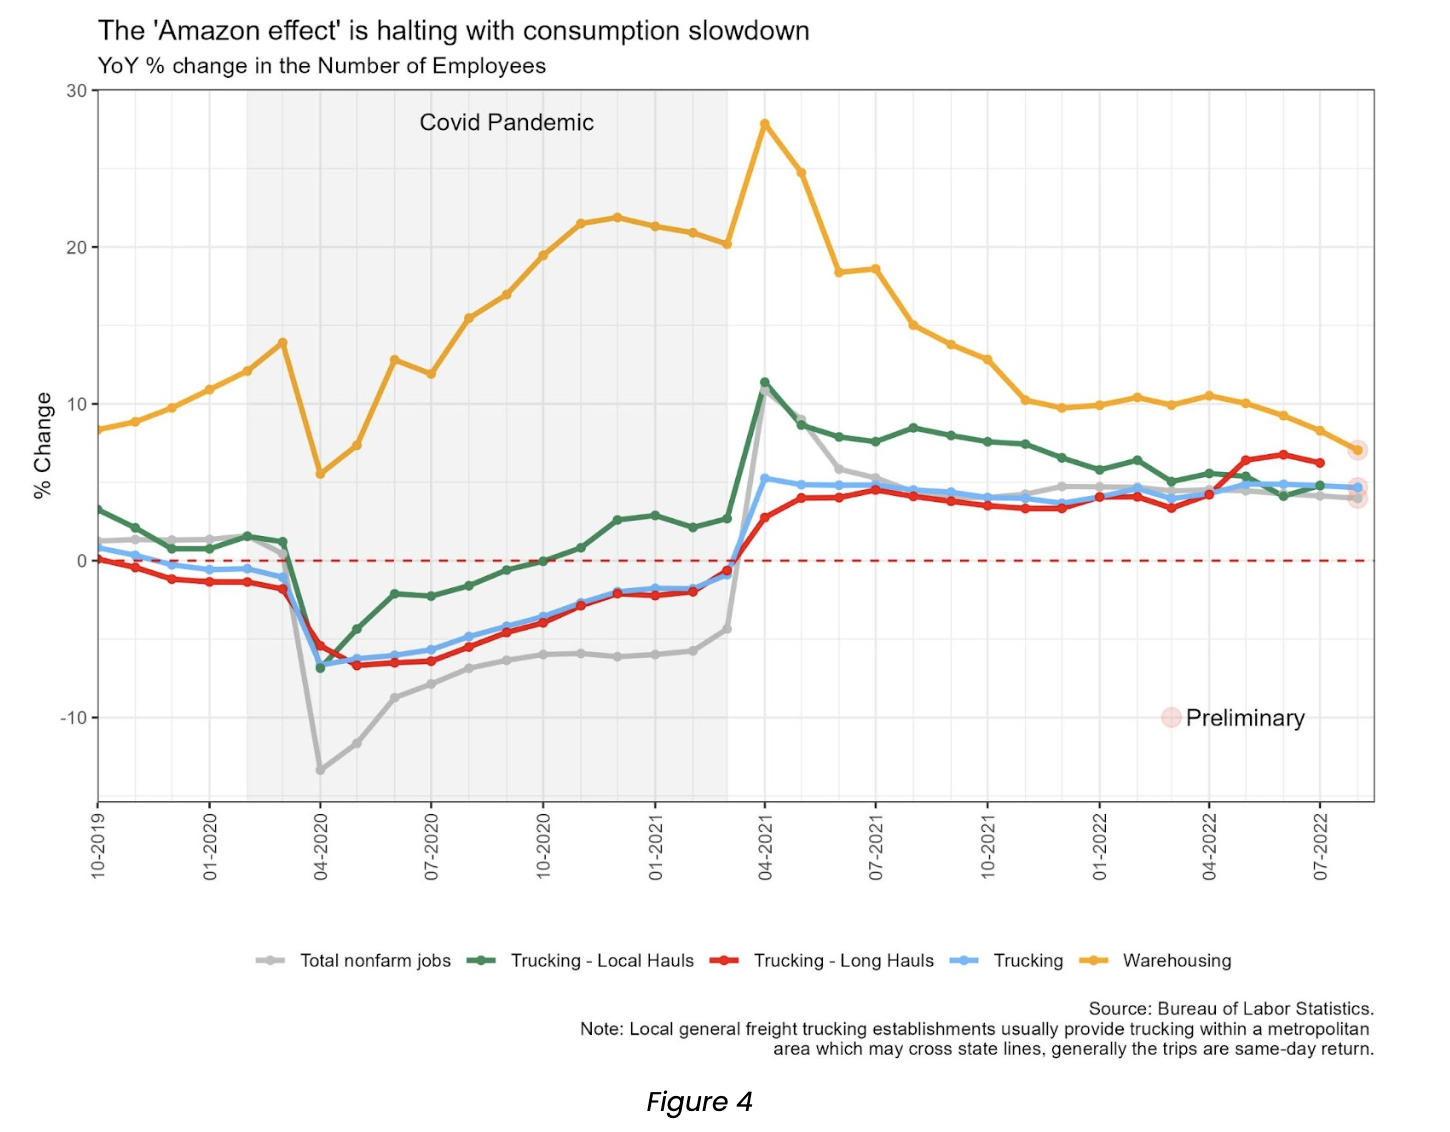
- Yet, these labor market trends from the “Amazon effect” were discontinued when the economy re-opened. In Figure 4, we see that:
- There has been consecutive declines in the hirings for warehousing since then.
- The job growth in long-haul trucking has overcome short-haul since May/22.
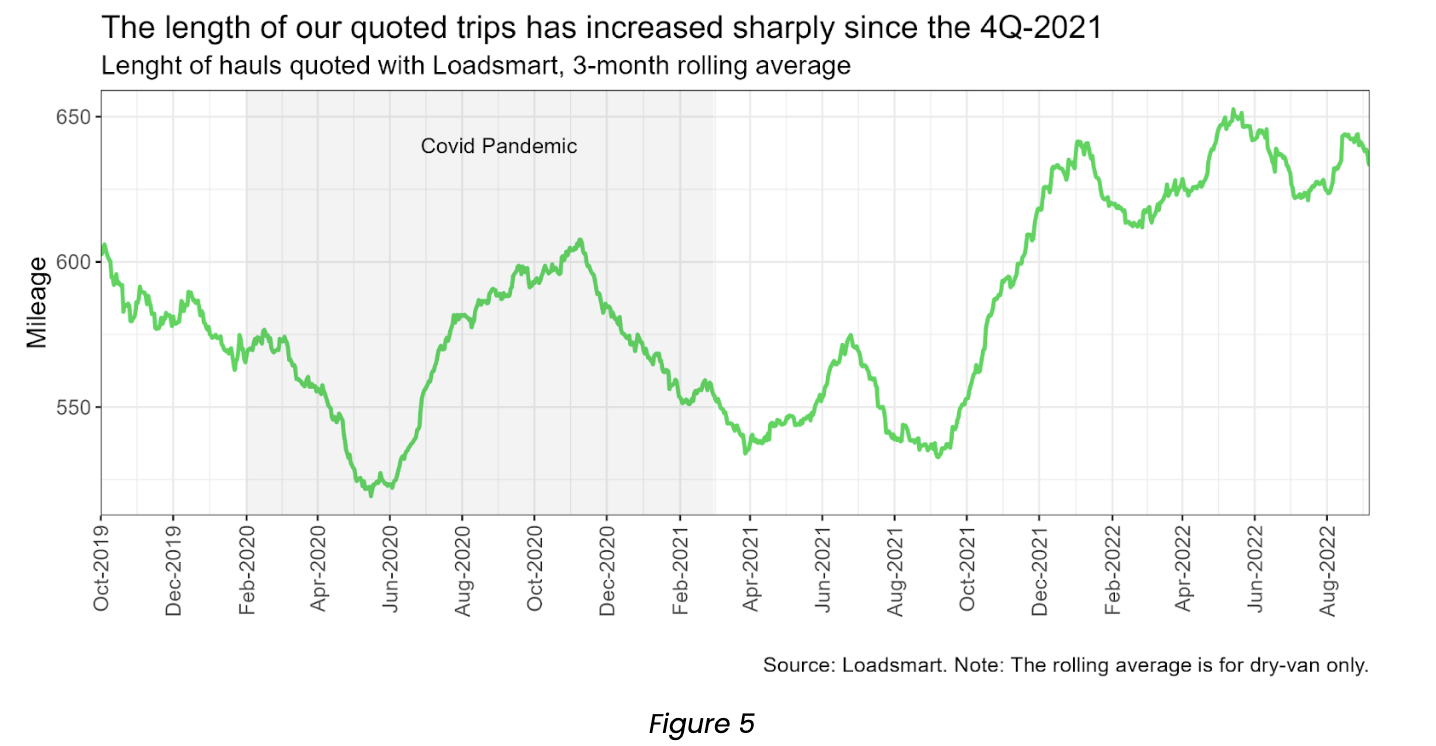
- By looking at Loadsmart data, we note that the average length of trips quoted has increased sharply at the end of last year and remains at similar levels till now – Figure 5. The average hauls length was certainly shorter during the pandemic, but there was no clear trend during the period.
Please reach out to Stella Carneiro (stella.carneiro@loadsmart.com) or Jon Payne (jonathan.payne@loadsmart.com) with any questions, suggestions, thoughts, etc. Thank you!