Share this
by jpallmerine
Say what you will about the softened freight market, September was certainly an exciting month. We experienced a muted market impact from Labor Day, we narrowly avoided nation-wide rail strikes, and a Category 4 hurricane, Hurricane Ian, made landfall on the southeastern coast of the US. Although there is still more to be seen from the impact of the hurricane as well as peak retail season, in September the excess capacity in the market easily absorbed most of the disruption that came its way.
As usual, in this Monthly Market Update, we will (a) provide a brief update/analysis of the full truckload market and (b) present some compelling trucking-related economic analysis to provide a macroeconomic view on the state of the market.
We hope you enjoy! #movemorewithless
Please reach out to Stella Carneiro (stella.carneiro@loadsmart.com) or Jon Payne (jonathan.payne@loadsmart.com) with any questions, suggestions, thoughts, etc. Thank you!
Full Truckload Market Overview
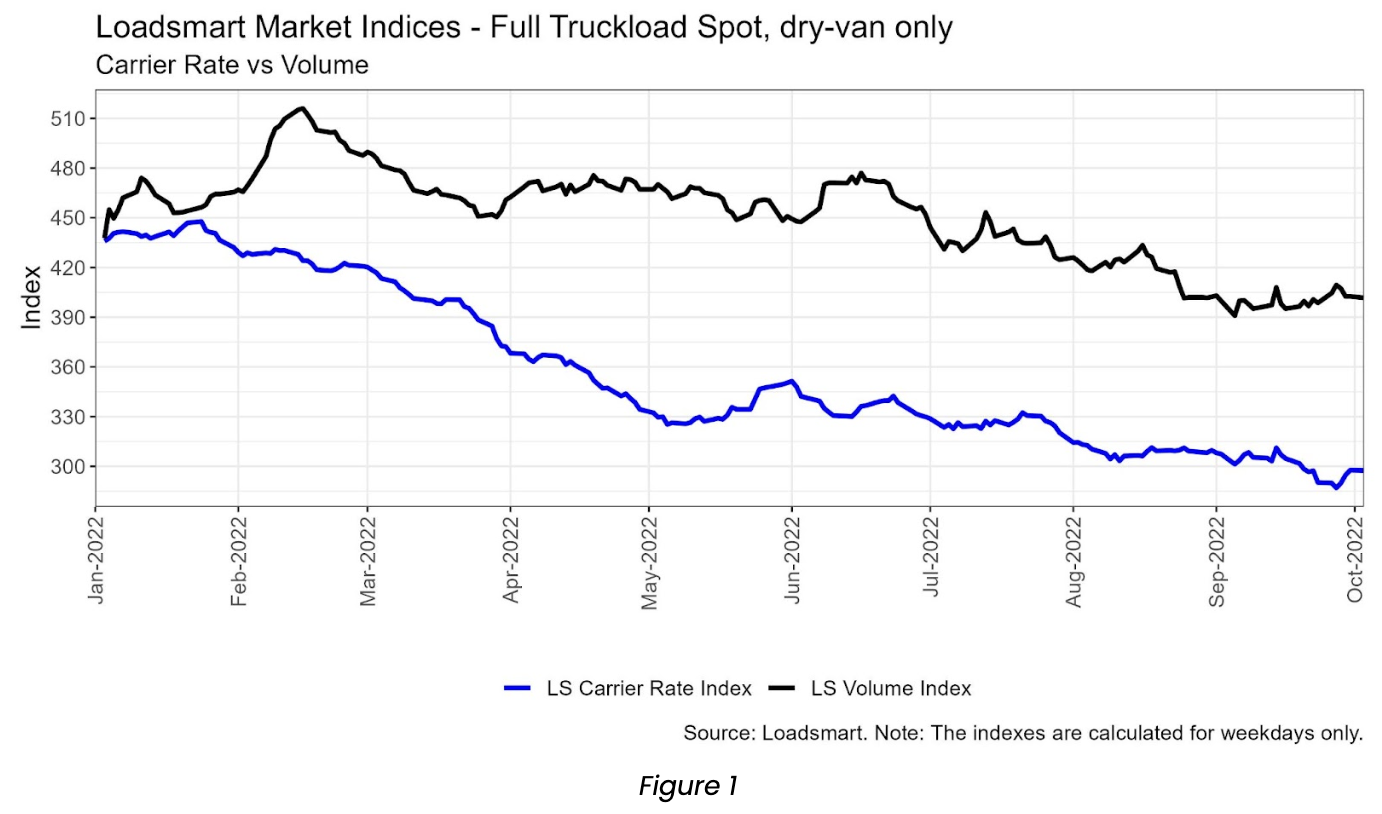
- Volumes: our volume index remained stable throughout the month of September (~0% change MoM). We see this stabilization as a positive sign in light of the volume declines of the past few months, suggesting that volumes could be starting to rebound as we enter the beginning of retail season in October.
- Rates: our price index declined 3% MoM, reaching a new yearly low in late September. During the first three weeks of the month, our index remained stable and at a level similar to August (~300 points), but in the fourth week it dropped to under 290 points. The pace of the rate decline has certainly become milder over the past 3 quarters (our price index dropped 15% QoQ in the 1Q, 11% in 2Q, and 9% in the 3Q). Despite the low expectations for peak season disruption, Loadsmart expects minimal to no rate declines in 4Q
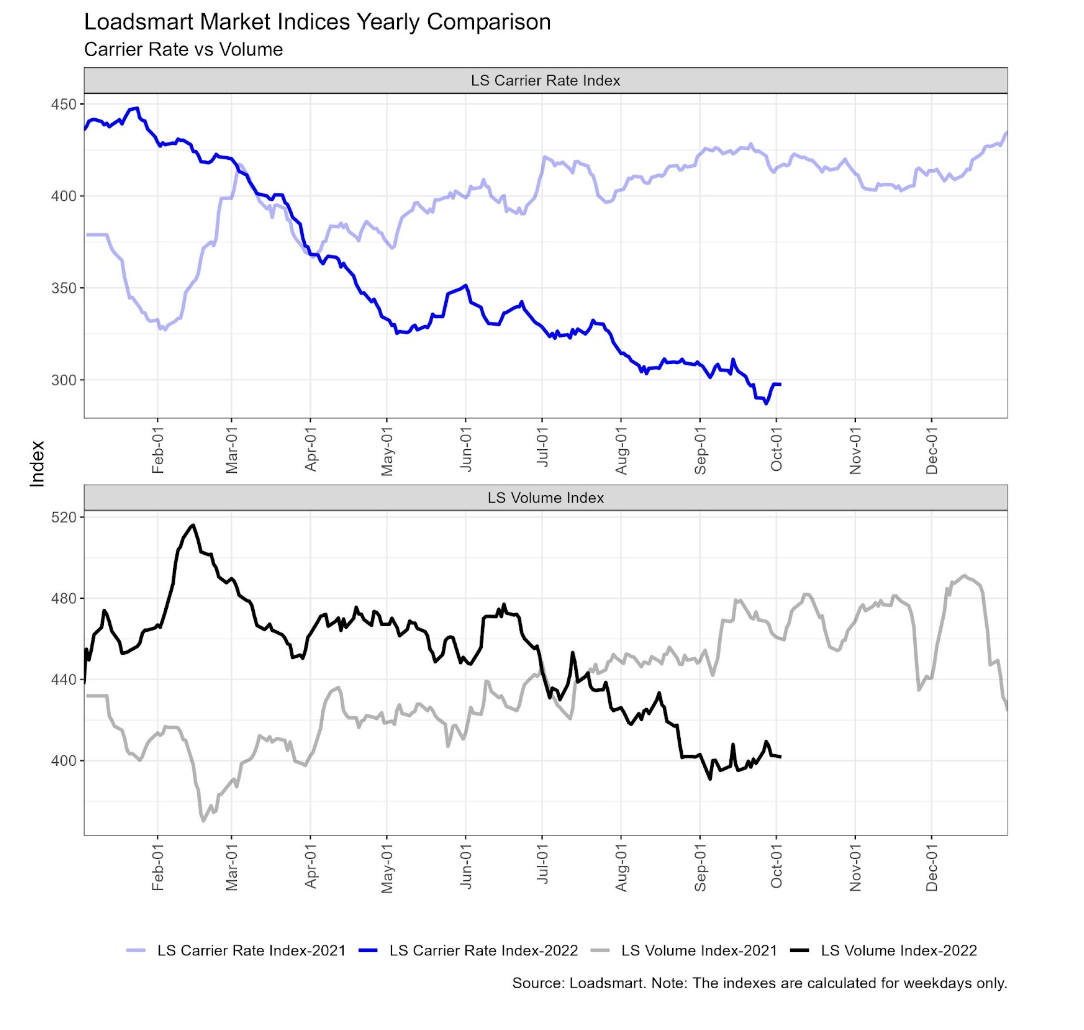
Below we’ve also provided YoY comparisons for our rate and volume indices, respectively.
What is Loadsmart expecting / watching closely in October:
- The beginning of RFP Season is upon us! Loadsmart’s current freight market outlook projects that we’ll remain in a deflationary market through Q3’23 and we’re currently approaching the floor for the spot market rate environment. Therefore we expect a competitive rate environment amidst this bid cycle as carriers/brokers will fight to grab as much primary freight as possible.
- As discussed below, contract rates have been coming down steadily since July 2022, and we expect this to continue at least through Q1’23
- As other industry experts have noted (see here), diesel prices are really the only remaining wild card that we think could materially impact the timing / depth of the floor in spot rates. Assuming no drastic declines in diesel to occur, we expect rates to hold steady in Q4 for the first time all year.
- In October we’ll also be watching closely for the release of national consumption spending data – with the 5th interest rate hike since March, we’re expecting to see the beginnings of deflationary consumption levels.
Freight & Economics
Hurricane Ian
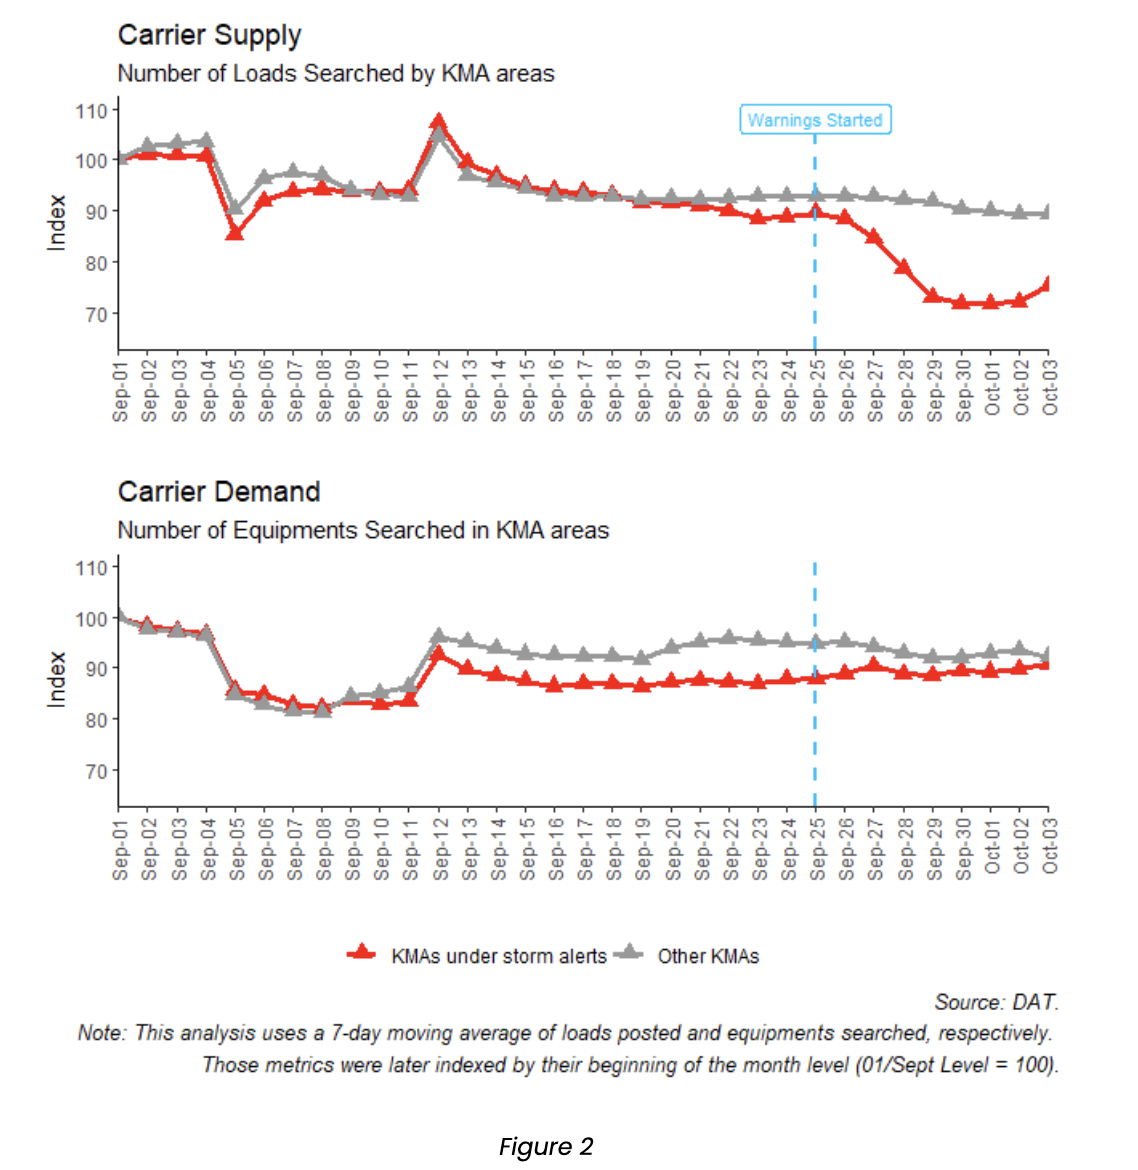
- The strongest storm to hit the US in 2022 brought damaging effects to the trucking industry as well. Our analysis shows that regions under storm warnings and watches had a carrier supply decline of 20% WoW (25 Sept to 02 Oct) since the alerts first started on 25 Sept – as seen in Figure 2. .
- Freight demand stayed roughly constant during the same period, which indicates that shippers had difficulties trying to find drivers willing to inbound into these areas.
Here are the details of our analysis:
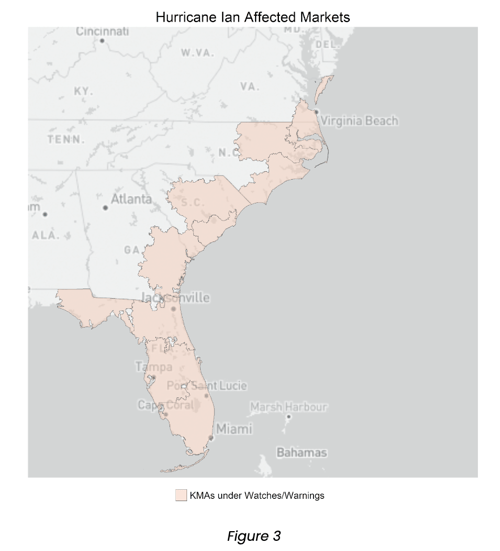
- We split the US Key Market Areas (KMAs) into two categories: the “KMAs under storm alerts”, who were under NHC alerts related to Hurricane Ian; and the “Other KMAs” , without any alerts – as shown in Figure 3.
- Further, we calculate two metrics for these categories using the DAT platform: (i) the 7-day rolling average number of loads searched, a proxy for carrier supply; (ii) the 7-day rolling average number of equipment searched, a proxy for carrier demand.
- Given that the territory covered by “Other KMAs” is about 25 times larger than the one covered by “KMAs under storm alerts”, we divide each daily metric by its beginning of the month observation (01 Sept). The results are presented in Figure 2.
Contract vs Spot spreads
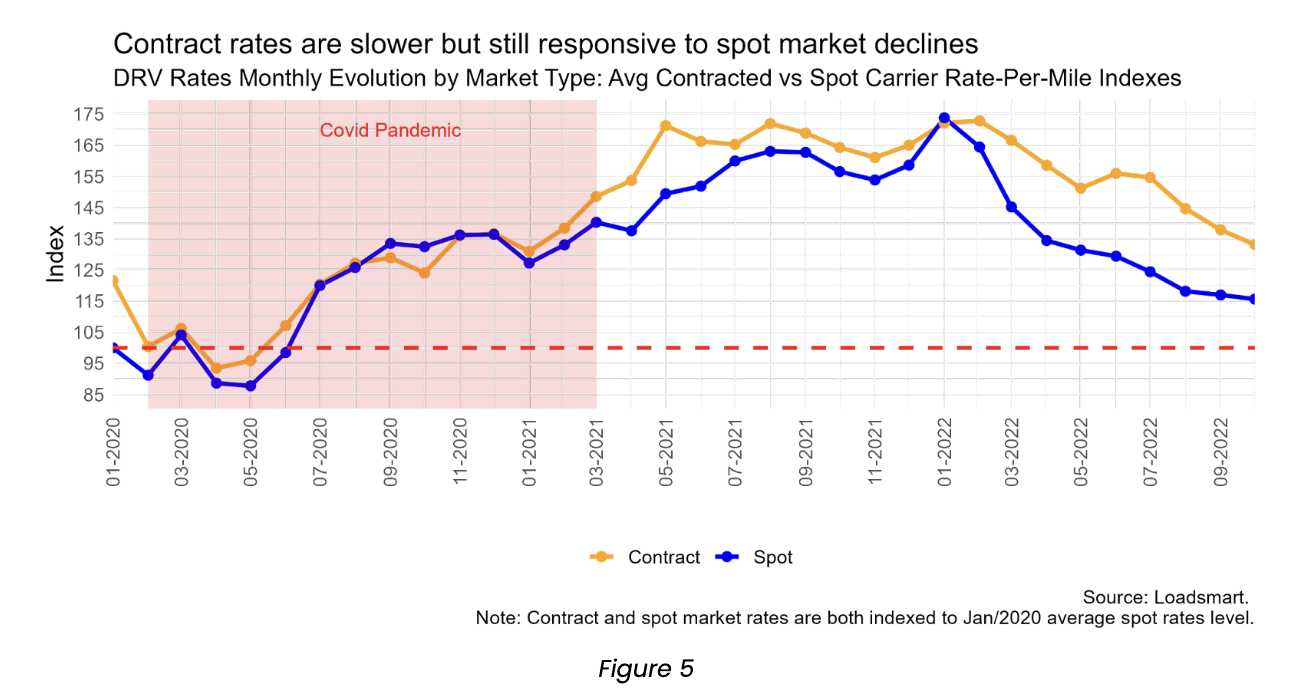
- The third quarter began with a trend reversal in the spreads between contract and spot markets – and ended with the consolidation of a new downward trend (i.e. contract rates began to decline at a rate fast enough that they began to close the distance from the much lower spot rates).
- In the last four consecutive months average spread in rates between the two markets fell around 50% (July to October) – Figure 4.
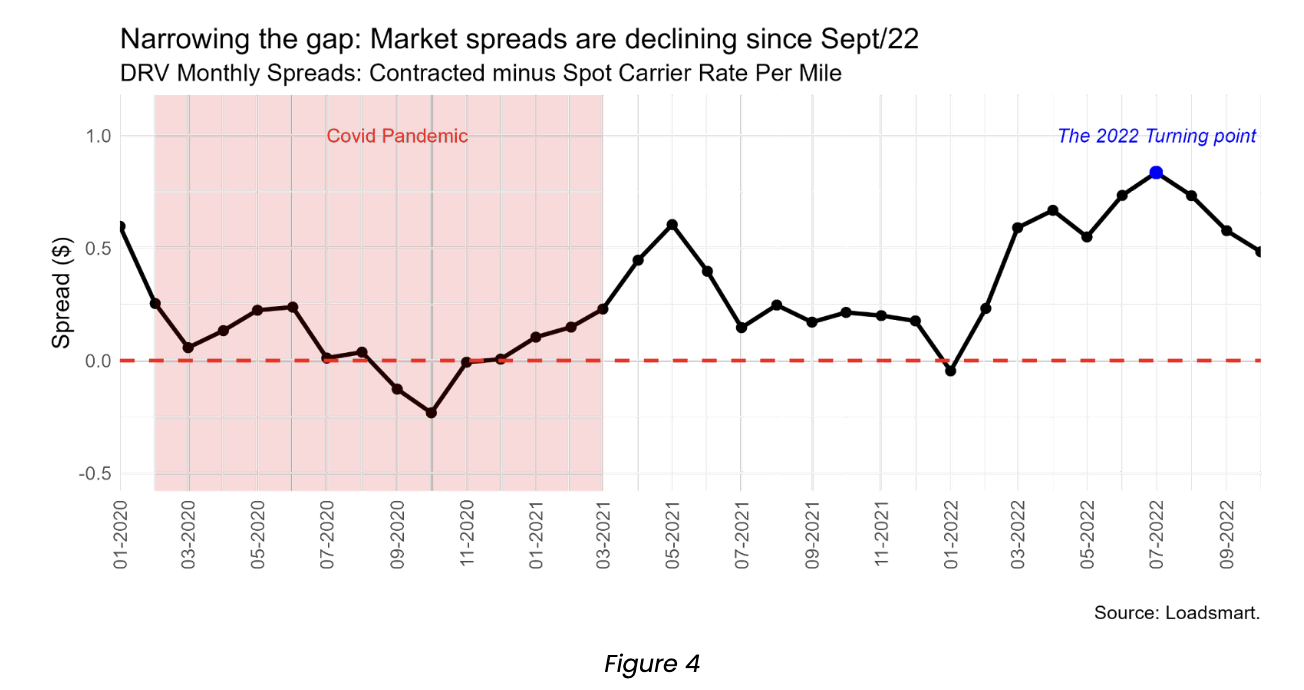
- As we all know and as seen in Figure 5, spot rates dropped successively throughout the year. Contract followed the lead for most months but had a flatter decline compared to spot until July, when the average spread between the two hit $0.85 cents.
- But since July, contract rates have started to catch up on this difference and the spread is currently at $0.50 cents (Figure 4). We expect an intersection of these rates in Q1 / Q2 2023 which will help push the freight market closer to an inflationary environment.