Share this
by jpallmerine
As usual, in this Monthly Market Update, we will (a) provide a brief update/analysis of the full truckload market and (b) present some compelling trucking-related economic analysis to provide a macroeconomic view on the state of the market.
We hope you enjoy! #movemorewithless
Full Truckload Market Overview
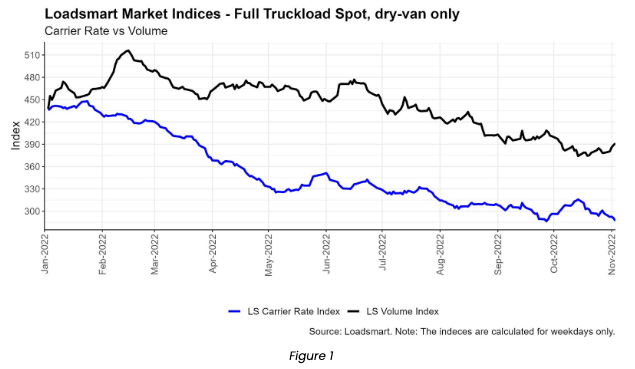
- Volumes: our volume index was 4% down in Oct (day 03 to 31). At the beginning of Oct, there was a large drop in loads booked for the NorthEast region, one of Loadsmart’s key market areas, which pushed our index to a new YTD bottom. This decline in NE volumes was temporary and ended by mid-Oct with the index mildly recovering by month end.
- Rates: our price index declined 3% during Oct (day 03 to 31). At the start of Oct, the index had a slight bump. This surge was mainly driven by the West Coast markets (Ontario and Los Angeles markets) which mirrored Sonar’s OTRI increases in these regions, suggesting that broader capacity had tightened in this region. The uptrend in WC prices ended by the third week of October, when prices dropped back to mid-September levels. The oscillation was confined to the WC, as prices remained constant in other regions.
Loadsmart’s Look Ahead:
- In terms of Peak Season disruption expectations, Loadsmart is generally aligned with much of the freight market commentary out there – we expect the excess capacity in the market to absorb any widespread Q4 rate disruption (overall rates should finish November flat compared to October).
- Of course on the actual holidays and their neighboring days, we do expect short-term rate hikes as usual as carriers take time to be at home
- Our previous stance that we’ll reach the spot rate floor in Q4 has been put into question.
- With Diesel up ~$0.50 in October and volumes hitting YTD lows, we may have reached the breaking point for carriers where they’re being forced to exit the market.
- There are, however, some notable market forces that could push spot rates lower into Q1’23 such as: the economic recession gaining downward momentum followed by imports & consumption spending declining more aggressively.
- Additionally, we’ve seen some carrier resilience (discussed below) recently that could push the timing of the spot rate floor out further
- If you’re curious around how rates typically move in Q4 peak season and what kind of impact could retail sales numbers have on Q4 truckload rates – click here for some research that we recently released on this subject
Freight & Economics:
Signs from overseas
- The post-pandemic downshift on shipping costs reached the freight industry in its multiple modes, but ocean shipping was probably the first to take the headwind.
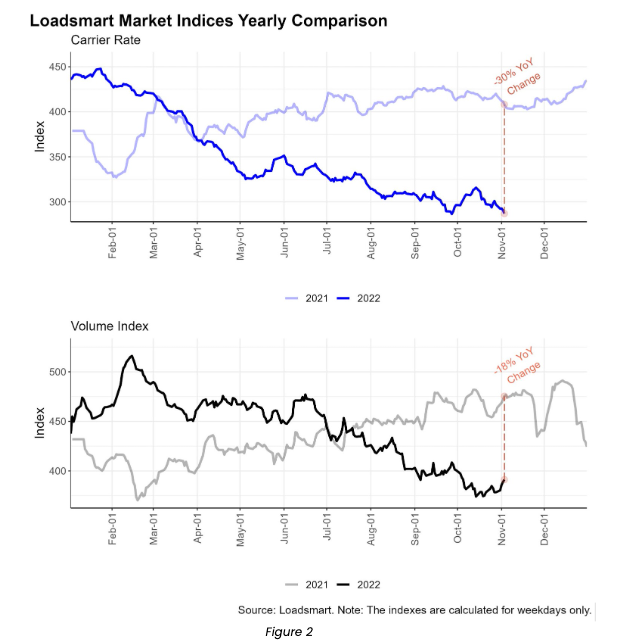
- Overseas maritime shipping started its downtrend four months before trucking. On Sept 21’, shipping prices on China -> US routes began to adjust amid the consumption demand weakening. For trucking rates, the adjustment came afterward on Jan 22’ – Figure 2.
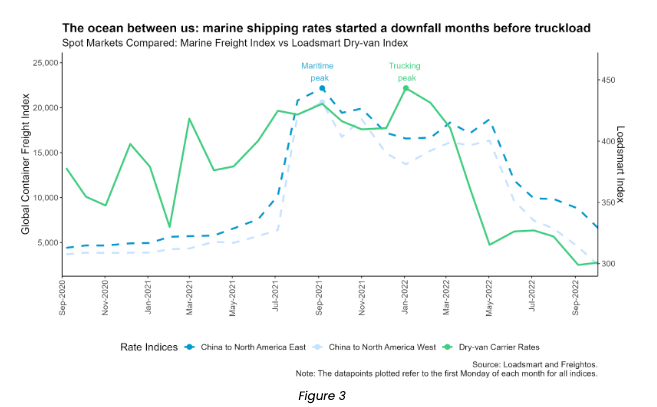
- It is hard to pinpoint a roadmap for trucking based on ocean freight – the former is known for its 3-year market cycles, while the latter has kept relatively stable rates throughout a decade till the pandemic outbreak.
- But in the most recent scenario, the fact that ocean rates have not yet found a floor makes trucking rates more susceptible to further drops – once the lower demand for imports might reflect that the consumer pullback will continue.
- Also, market-wise, expectations can help shape reality and the looseness of the ocean freight market will likely encourage shippers to keep pushing for lower rates on land as well.
Capacity outlook
- September cast a shadow over the trucking industry with negative macro data from some of its main inputs: labor and capital. On labor, the trucking sector lost 17,800 jobs, the biggest loss since Jan 2021. On capital, heavy weight trucks retail sales decreased by 6% MoM – Figures 4.
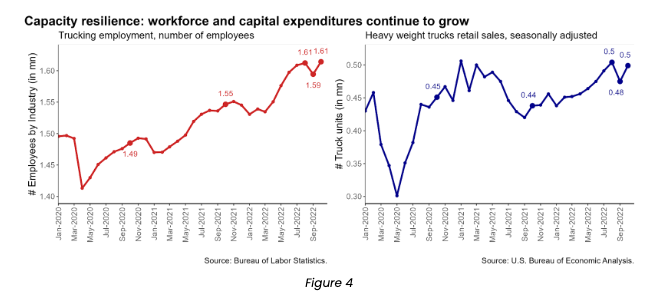
- The negative news echoed throughout the freight industry and led analysts to believe in the onset of a capacity adjustment phase for trucking. However, October data has shown there is no consolidated market trend, as both the workforce and truck sales have returned to Aug levels right after the September slip.
- The latest data points, therefore, suggest no noticeable capacity contraction so far. In fact, an annualized comparison points out that payrolls had a 4% YoY growth (the same rate as last year’s), while truck sales rose 14% YoY.
- Supply adjustments can take a while, especially during the holiday season when there may be a blip in demand for freight. Carriers are resisting and postponing layoffs and capital expenditures cuts to next quarter.
Please reach out to Stella Carneiro (stella.carneiro@loadsmart.com) or Jon Payne (jonathan.payne@loadsmart.com) with any questions, suggestions, thoughts, etc. Thank you!