Share this
by jpallmerine
As usual, in this Monthly Market Update, we will (a) provide a brief update/analysis of the full truckload market and (b) present some compelling trucking-related economic analysis to provide a macroeconomic view on the state of the market.
We hope you enjoy! #movemorewithless
Please reach out to Stella Carneiro (stella.carneiro@loadsmart.com) or Jon Payne (jonathan.payne@loadsmart.com) with any questions, suggestions, thoughts, etc. Thank you!
Full Truckload Market Overview
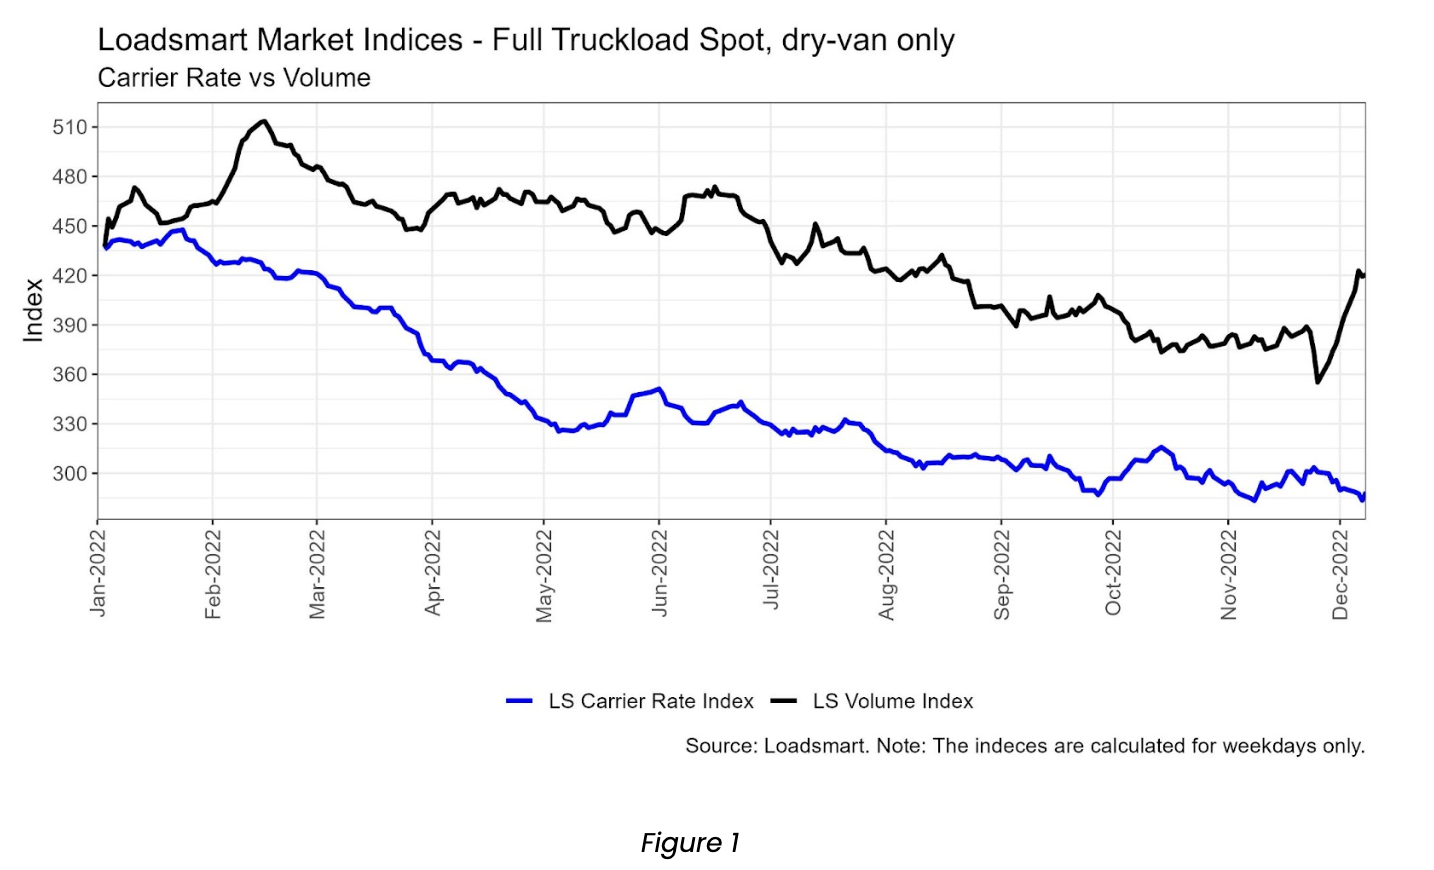
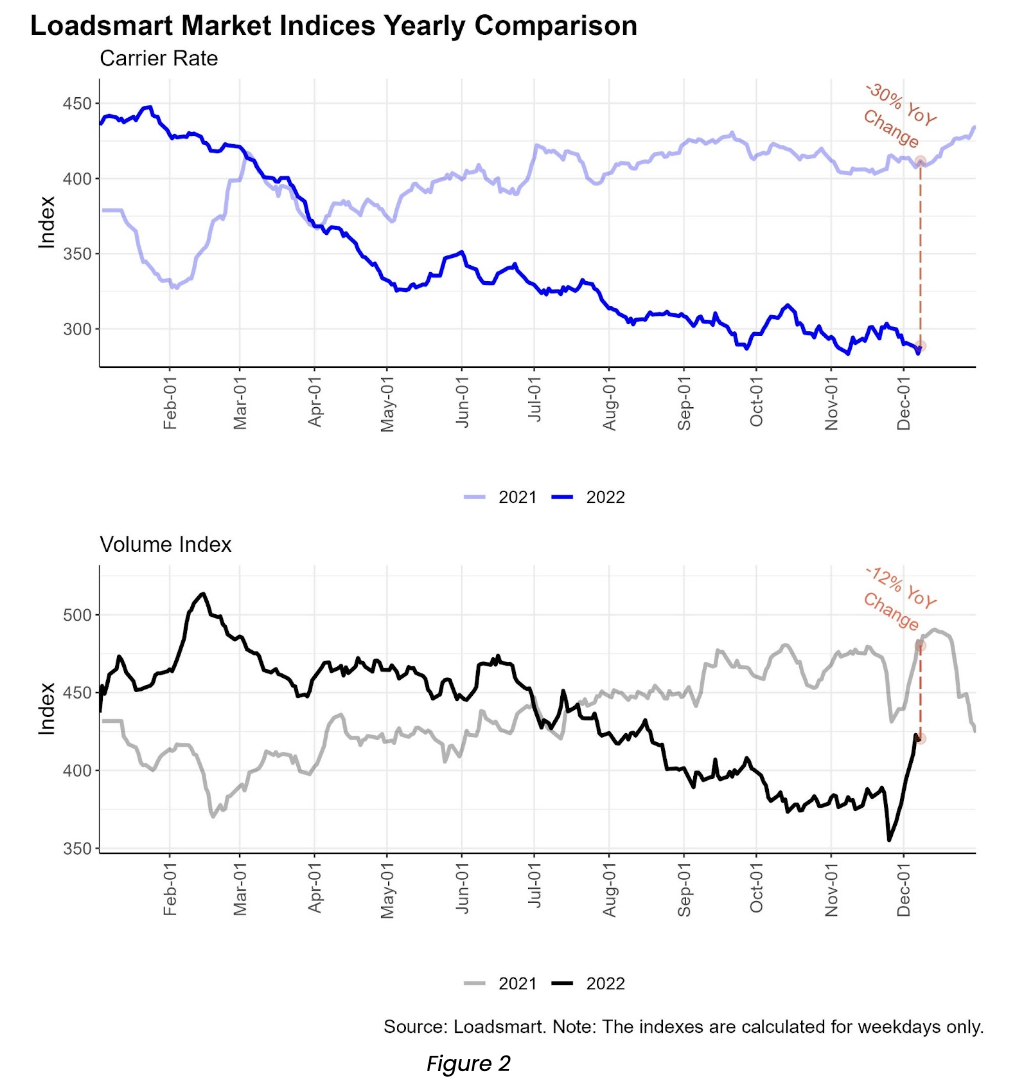
- Volumes: our volume index remained stable in November (day 01 to 31). This month’s index behavior mirrored last years’ given the expected Thanksgiving blip – see Figure 2. Volumes were somewhat constant throughout the month till the 24th, plunged on the 25th, and rebounded post-holiday, likely driven by the Black Friday shipping boost.
- Rates: our price index also remained stable in November (day 01 to 31). The Thanksgiving holiday temporarily seized the downturn in carrier prices. The index peaked on Thanksgiving day (Nov 24), mainly driven by the Southwest and West regions, where prices increased over 5% WoW on the holiday. After the holiday, prices slide back towards beginning-of-the-month levels.
Loadsmart’s Look Ahead:
- For the rest of December, we believe truckload rates will remain largely unchanged with some typical holiday activity to be expected around Christmas & New Years (volume dips, minor rate increases).
- For Q1’23, the burning question for the freight market seems to be: will truckload spot rates drop further or have they hit their floor? Loadsmart currently forecasts another 5-10% spot rate decline in Q1’23, largely due to expected consumption slow downs (amidst a higher interest rate environment and recession) paired with the fact that Q1 is typically a softer freight market.
- Contract rates will also likely experience a more significant decline in Q1 than what we have seen in the past 6 months, as the network bid reset for 2023 will finally begin to take hold.
- As mentioned in the section below, we also expect flatbed rates to decline significantly in Q1 due to the high mortgage environment and corresponding slow down in construction spending.
Freight & Economics
Flatbed and housing market strength
- Unlike dry van spot rates, which nosedived in the first quarter of 2022 in response to sluggish consumer demand and excess trucking capacity, flatbed rates declined more smoothly along the year. On a year-to-date basis, flatbed declined by only 9% while dry van rates have already dipped over 30% – as displayed in Figure 3.
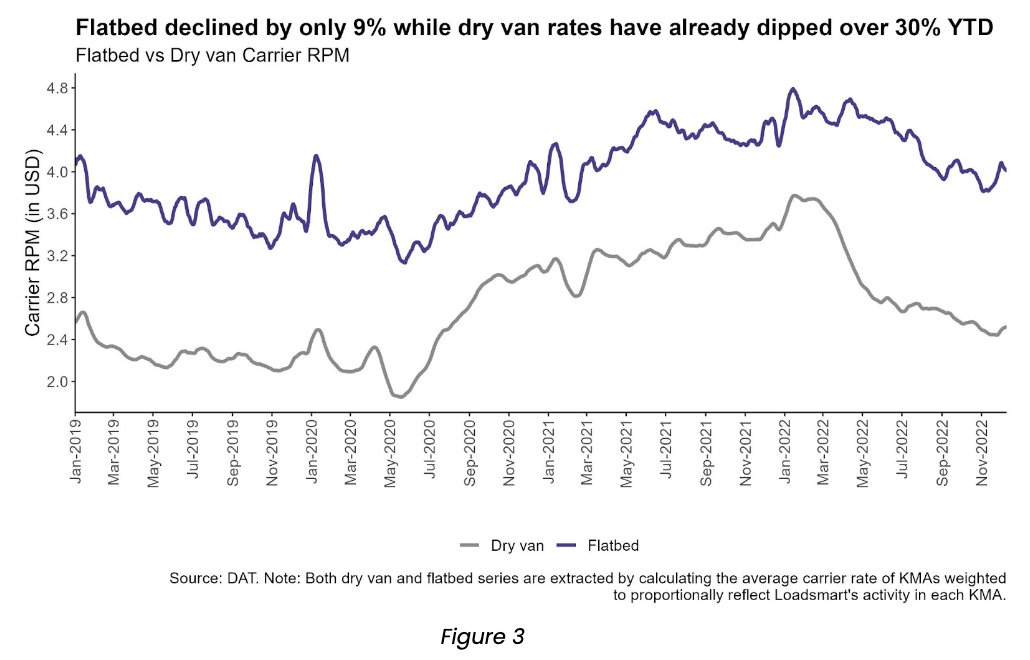
- As seen above, the flatbed trucking market follows a similar pattern to the dry van market, but flatbed constantly experiences diverging market shifts from dry van, as it depends on a much more specific set of industrial commodities. Flatbed is tied much more closely to housing and construction, for example, which took longer than others to react to the 2022 economic activity slowdown. Residential construction spending growth trajectory was only reversed in May, while consumer spending on general goods (vital for the dry van business) began slowing in January – see Figures 4 and 7.
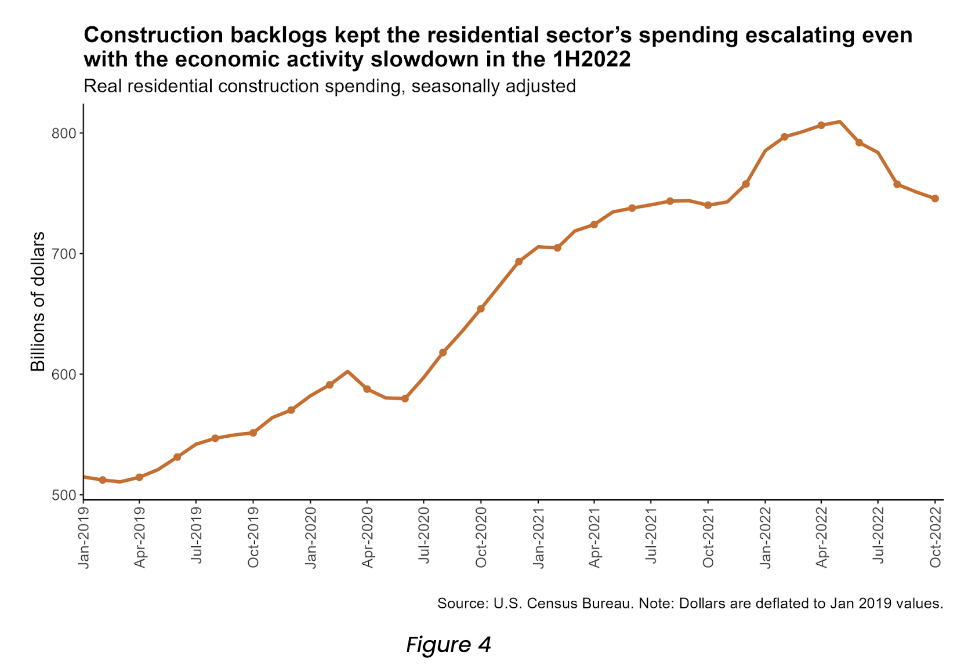
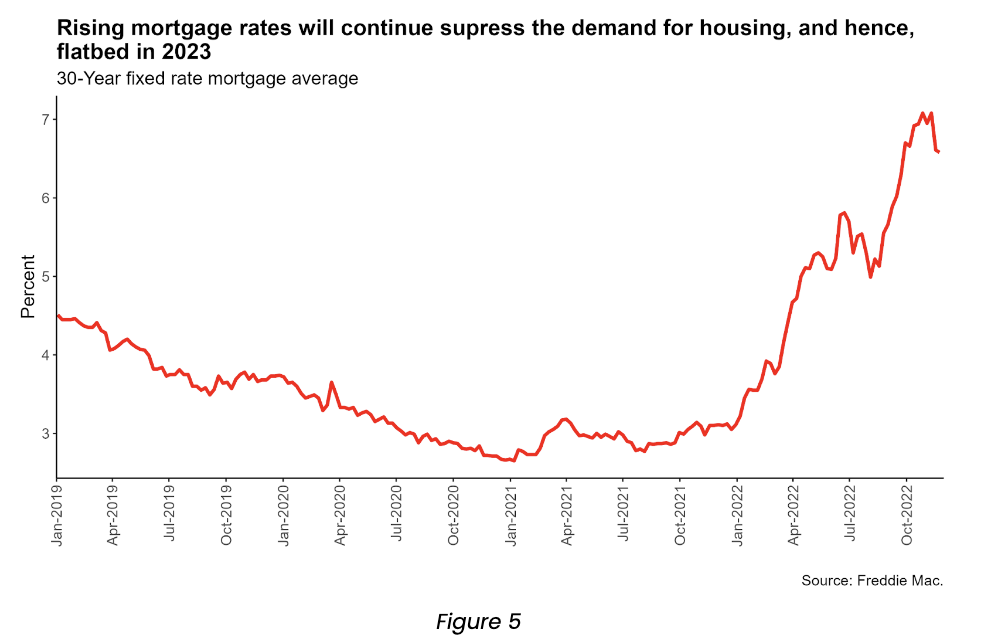
- The relative strength from homebuilding rested in the fact that the US housing market is undersupplied, and logistics bottlenecks restrained homebuilders from promptly catching up with the post-pandemic surge in demand. They have built extensive backlogs over this period that sustained the sector even after housing demand crumbled with the rise in mortgage rates in March – Figure 5.
- The backdrop was still favorable for the flatbed market during the first semester of 2022 and this was what kept its rates afloat while the dry van market sank. But in the second half of the year, flatbed was more harshly hit by the housing market downturn. As seen in Figure 3, flatbed rates declined by 6% from July to November.
- We expect further flatbed rate compression in the first half of 2023 as mortgage rates will likely continue on an upward cycle at least through the next year’s first quarter.
Consumption rebound
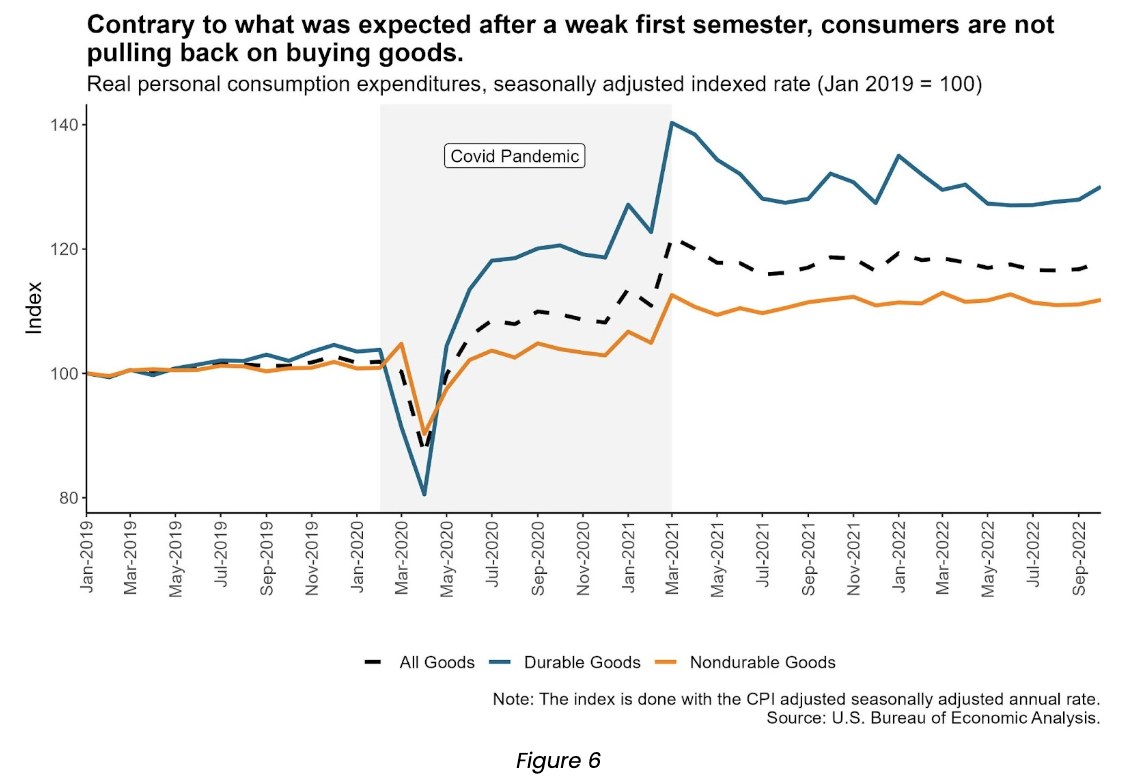
- Consumption data for this semester is having an unexpected recovery. The demand for goods, especially durables, rose for the fourth consecutive month in October – as shown in Figure 6 – despite the rising inflation and labor market easing. Overall goods consumption grew 1% MoM and durables, 1.6%.
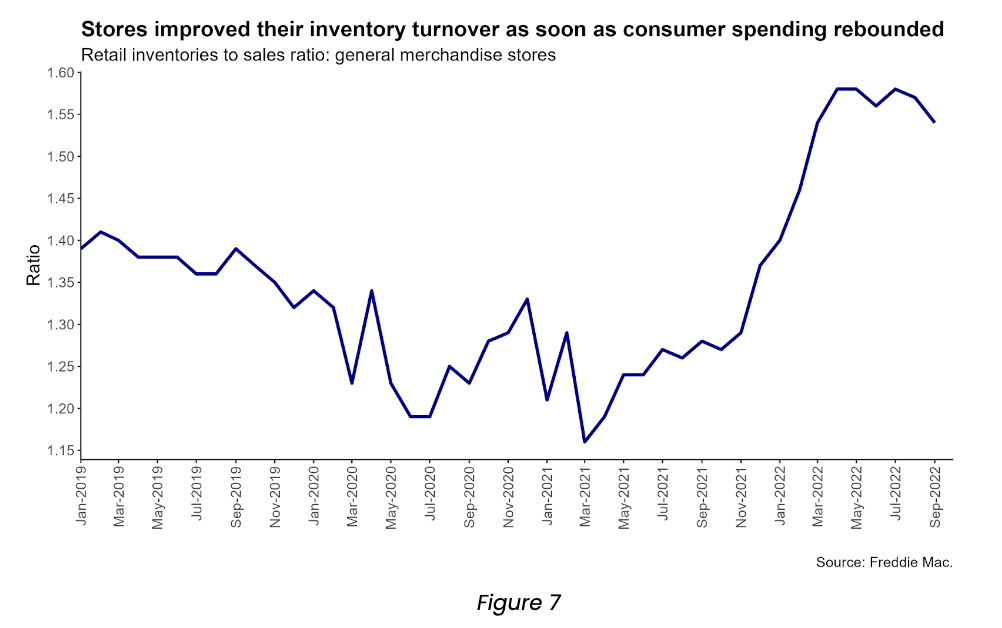
- This consumption increase did not translate into a higher demand for truckload shipping, likely due to historically high retailer inventory levels. However, the increased consumption was enough to ease inventories to sales ratio from 1.58 to 1.54 in the 3Q for general merchandise stores, as depicted in Figure 7.
- There are worrying signs that the latest consumer spending spree could be reaching its limit as personal savings rate fell to its 17-year low: the savings rate as a share of disposable income was 2.3% in October, according to data from the Bureau of Economic Analysis. Therefore, we do not expect improvements in trucking rates derived from further demand surges anytime soon.

About Loadsmart
Transforming the future of freight, Loadsmart leverages artificial intelligence, machine learning and strategic partnerships to automate how freight is priced, booked and shipped. Pairing advanced technologies with deep-seated industry expertise, Loadsmart fuels growth, simplifies operational complexity and bolsters efficiency for carriers and shippers alike. For more information, please visit: https://loadsmart.com.