Share this
by jpallmerine
As usual, in this Monthly Market Update, we will (a) provide a brief update and analysis of the full truckload market and (b) present some compelling trucking-related economic analysis to provide a macroeconomic view on the state of the market.
We hope you enjoy! #movemorewithless
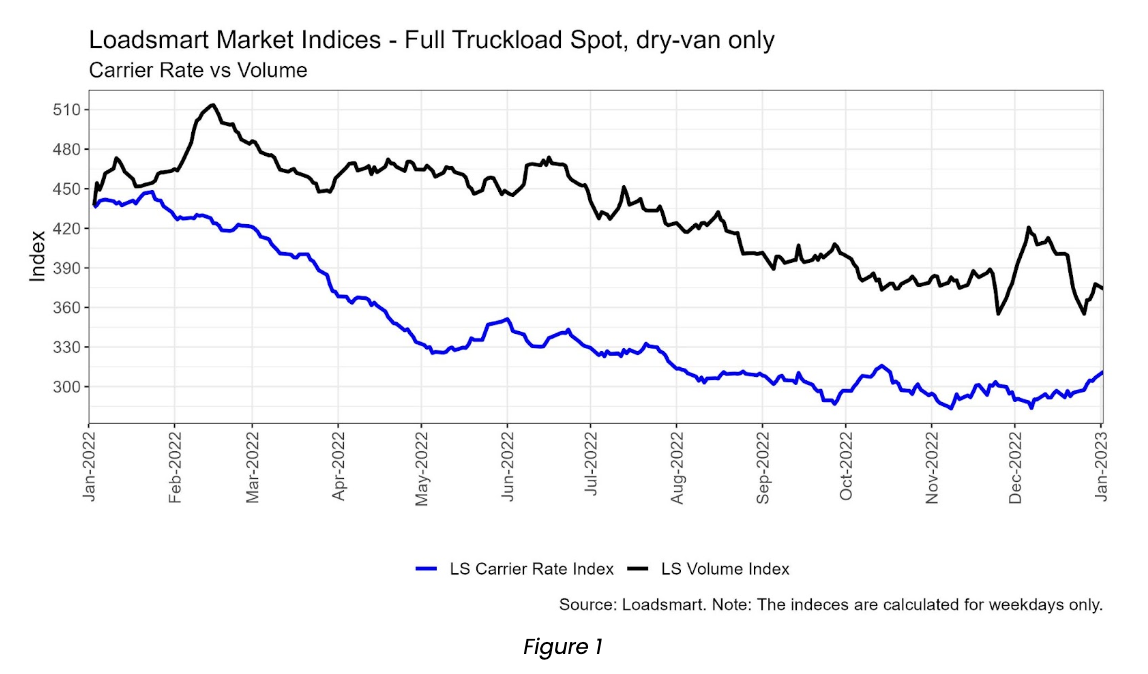
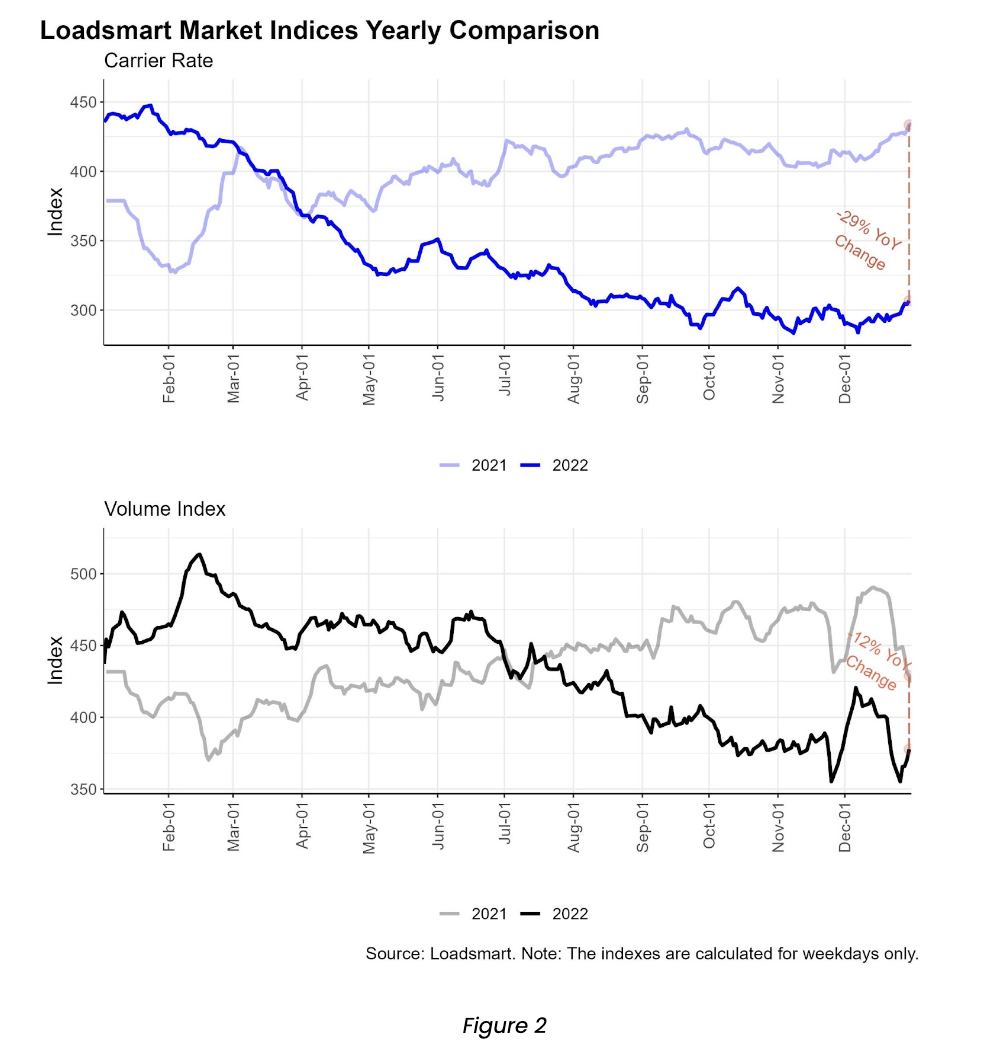
- Volumes: Our volume index declined 2% in December (day 01 to 31), although the index’s average over the month was 3.6% higher than in November. There was a clear holiday bump similar to 2021-2022 (Figure 2) – demonstrating that the holiday season was not entirely muted.
- Rates: Our price index increased 6% in December (day 01 to 31). Rates remained somewhat constant during the first two weeks of the month, but took an upturn in the third week as the holidays approached. The small hike in rates was generalized across regions.
- Our index’s behavior was similar to both DAT and Sonar VOTRI data, both started rebounding in the third week of December. Sonar VOTRI soared 50% in December, the biggest MoM rise in 2022 – this is expected to come back down as carriers return to work after the holidays.
- Our index’s behavior was similar to both DAT and Sonar VOTRI data, both started rebounding in the third week of December. Sonar VOTRI soared 50% in December, the biggest MoM rise in 2022 – this is expected to come back down as carriers return to work after the holidays.
Loadsmart’s Look Ahead:
- In the first couple months of 2023, our few things we will be focusing on: (a) Will we finally reach the floor for the spot market? (b) Will contract rates take a more dramatic dip to meet up with spot rates? (c) Will freight volumes soften further? Our current stance on these questions are as follows:
- (a) Yes – Our current forecast predicts a bottom by mid-February. If diesel declines dramatically, it could push this out, but there should be enough capacity exiting the market that we see a bottom in the next month or so.
- (b) Yes – Analyzing our bid submissions and respective pricing feedback from RFP’s over the past 3 months shows us that contract rates appear to be resetting to at least a 10-15% discount to previous contract rates. Many of these come online Q1.
- (c) Maybe – Major economic indicators have been telling a mixed story. On one hand, industrial production and real personal consumption remain relatively healthy (+2.5% YoY and +2% YoY, respectively). On the other hand, consumption and production are slowing growth rates along with the high interest rate environment, casting a shadow over 2023 for the consumer.
Freight & Economics
Online shopping consolidation:
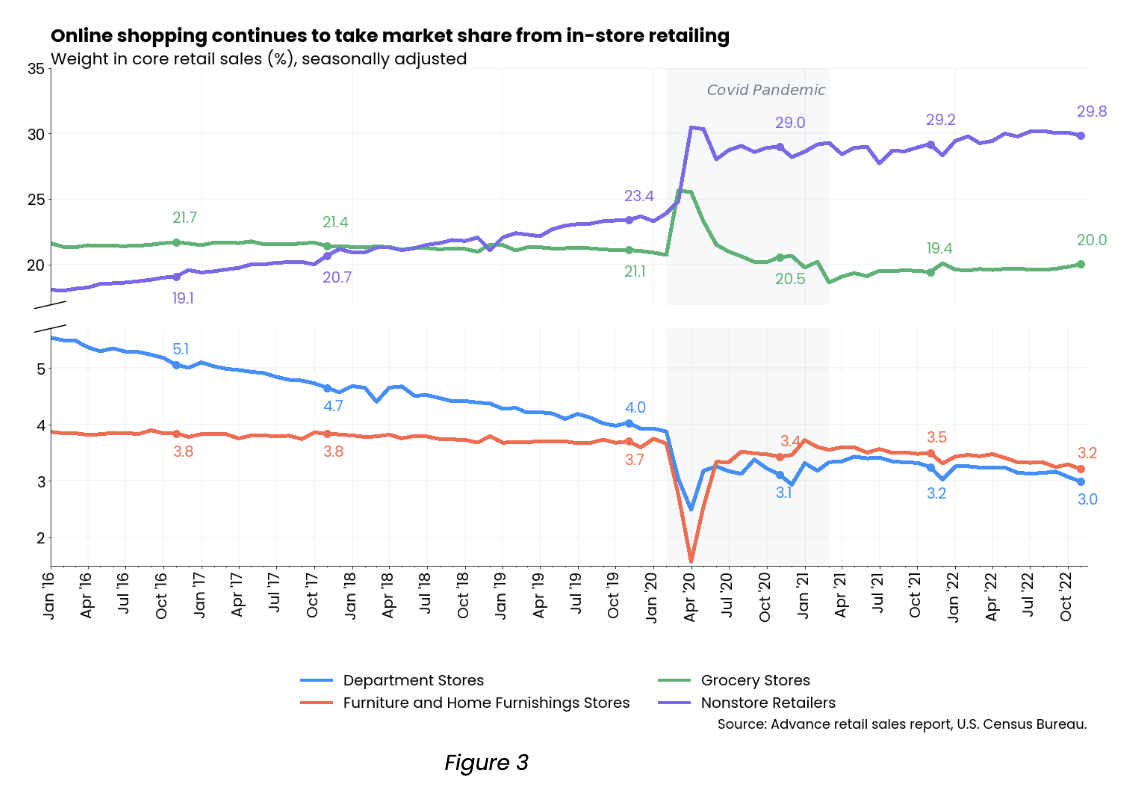
- Online shopping has proven it is here to stay. In 2022, despite the easing of covid concerns, and the lack of social restrictions within the US, the market share of non-store retailers grew even more than in 2021. In Nov, 29.8% of core retail sales were non-store, an increase of 6 p.p. YoY – Figure 3.
- Retailers envisioned that consumers would shift back to in-store shopping once city streets went completely back to life. But, conversely, 2022 consolidated the downfall of brick & mortar. Departments and furnishing stores have both lost market share over the year, moving further away from their pre-pandemic weight levels.
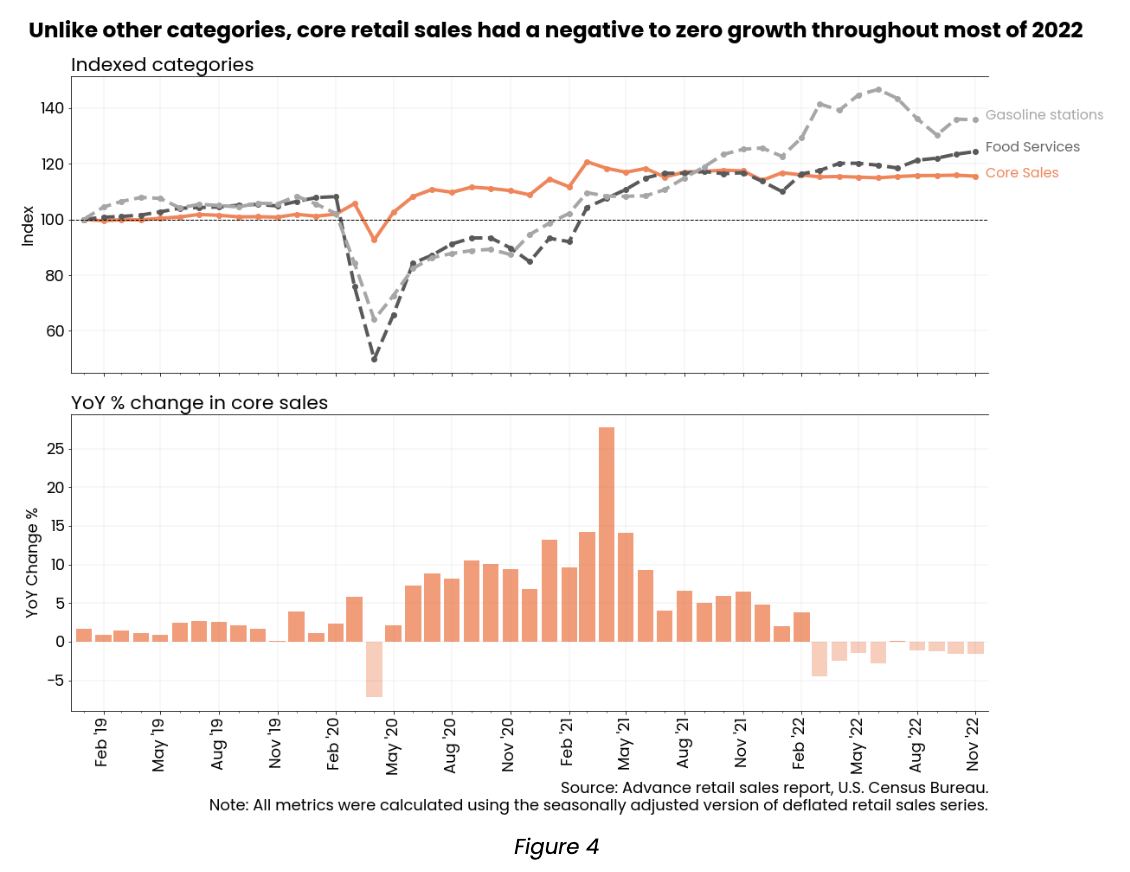
- Although weights have shuffled based on stores’ categories, the overall prospect for core retail remains gloomy. The advance estimates of U.S. retail sales show that core industries sales have had a poor year-over-year performance (negative or near zero) since March 2022 – Figure 4.
- We consider that core sales metrics have a more direct impact on the dry-van truckload market as it excludes sales of cars, gasoline, building materials and food services. But the “strength” of November retail data was concentrated within these categories. Gasoline stations and food services sales were up 6.5% and 8.5% YoY; while core retail was 2% down from last year – Figure 4.
Winter storm:
December was marked by winter storms that triggered weather alerts across the country. According to NWS data, more than half of the country was under an alert during the past month. On the map below, Figure 5, we highlight regions that received at least one alert in this period. We filter for alerts tagged as severe and containing travel advice in order to select the areas that were more susceptible to logistical disruptions.
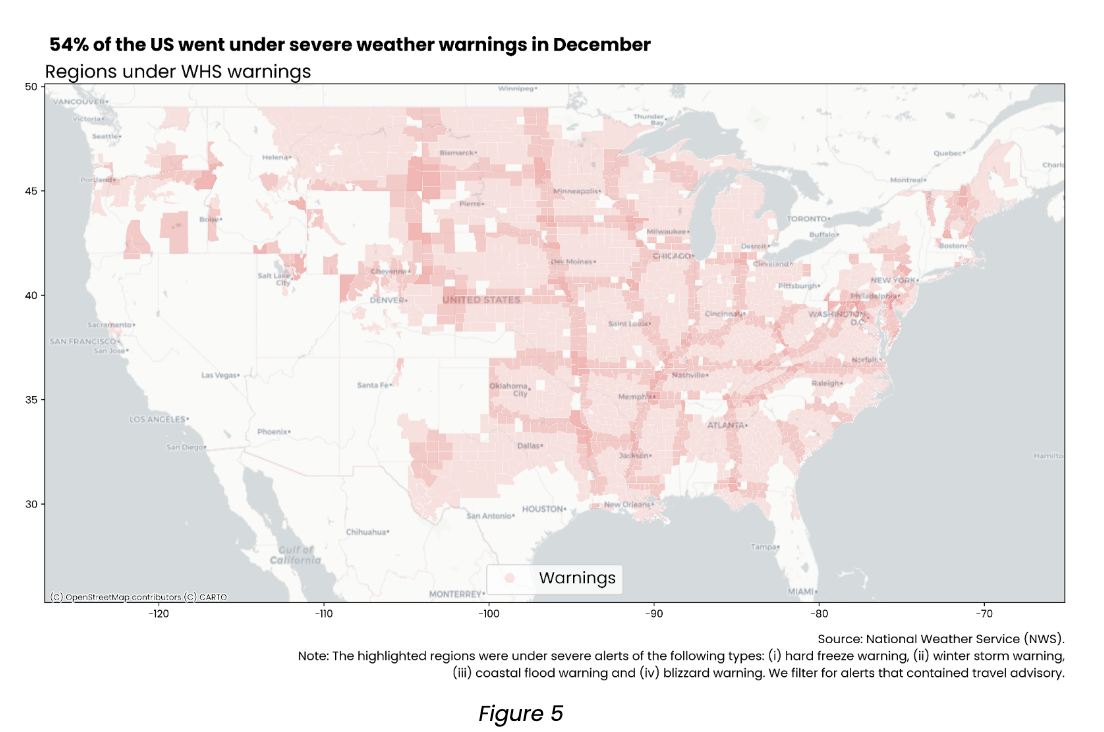
- Loadsmart activities were affected by the rough weather as most of our operations are concentrated in the highlighted regions – 58% of the loads handled by Loadsmart in 2022 were delivered within the affected areas charted above.
- Although our core indexes (volumes and rates, shown in the Full Truckload Market Overview section) remained roughly stable, but after digging deeper into our operational metrics in the highlighted areas, the potential effects of the storms became apparent.
- The percentage of cancellations and rolled loads per total volume of delivered loads increased 29% MoM in December in the areas with warnings, whereas this ratio increased only by 10% MoM in areas without warnings.
- We also reviewed lead times between the booked date with the shipper and the date we had the carrier assigned the load. Unsurprisingly, this metric had a much higher increase in the area with warnings when compared to the rest of the country – a 46% increase vs 22%, see Figure 6.
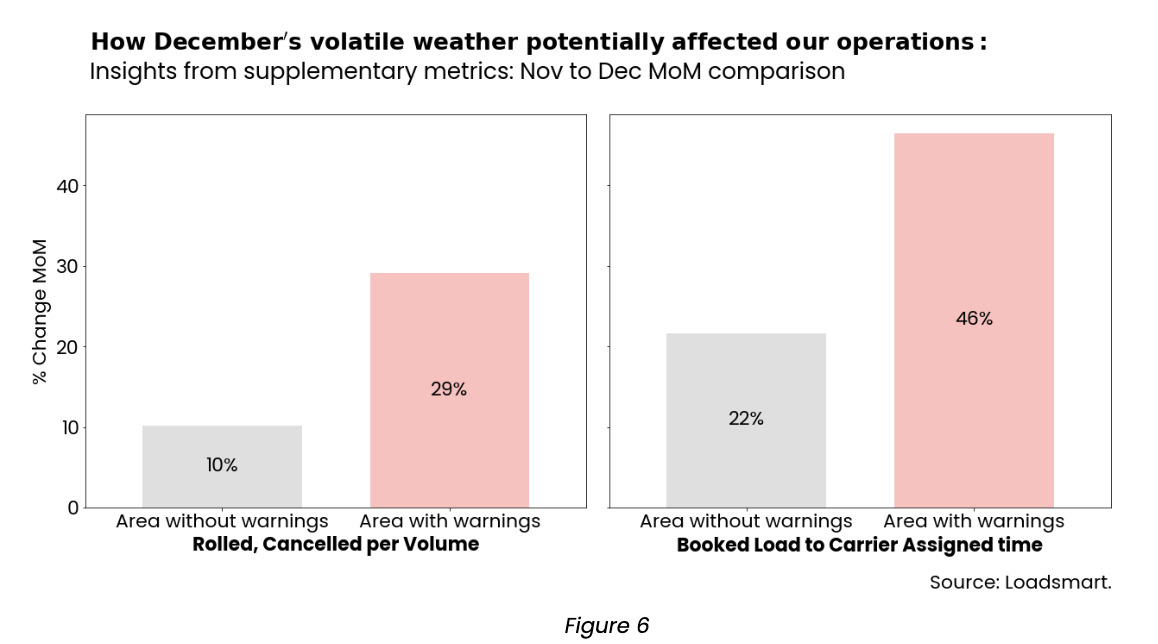
- December is typically characterized by a worsening in operational figures, lead times and fault deliveries were expected to rise given the busyness of the holiday season, but we believe that the difference among the two regions’ metrics can evidence the potential disruptions brought by bad weather conditions.
Please reach out to Stella Carneiro (stella.carneiro@loadsmart.com) or Jon Payne (jonathan.payne@loadsmart.com) with any questions, suggestions, thoughts, etc.

About Loadsmart
Transforming the future of freight, Loadsmart leverages artificial intelligence, machine learning and strategic partnerships to automate how freight is priced, booked and shipped. Pairing advanced technologies with deep-seated industry expertise, Loadsmart fuels growth, simplifies operational complexity and bolsters efficiency for carriers and shippers alike. For more information, please visit: https://loadsmart.com.