Share this
by jpallmerine
As usual, in this Monthly Market Update, we will (a) provide a brief update/analysis of the full truckload market and (b) present some compelling trucking-related economic analysis to provide a macroeconomic view on the state of the market. We hope you enjoy! #movemorewithless
Full Truckload Market Overview
Volumes
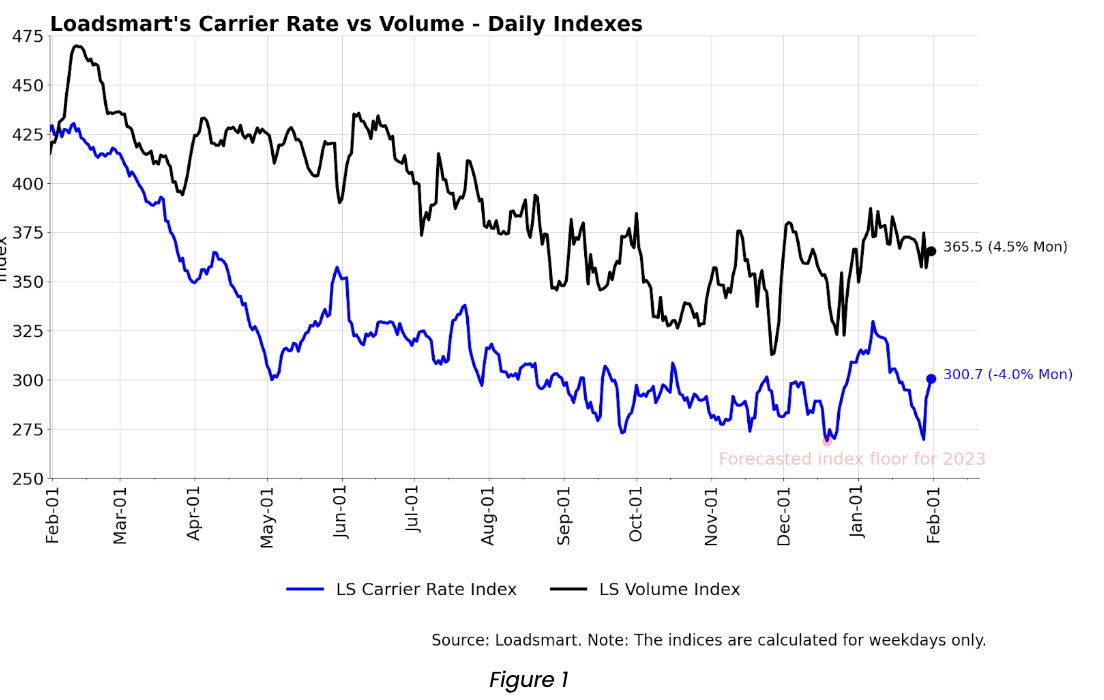
Our volume index increased by 4.5% in January (day 01 to 31). The daily average of volumes for January rose to the highest since August 2022. This volume hike was unexpected as the January to March period is typically defined as a “quiet post-peak season”, but we speculate this could have been a delayed effect of the holiday shipping season, which was largely muted in Q4’22. The Midwest (Illinois, Ohio, Missouri, and Wisconsin) contributed the most to the rise in volumes, as 44% of LS volumes moved in January came from this region.
Rates
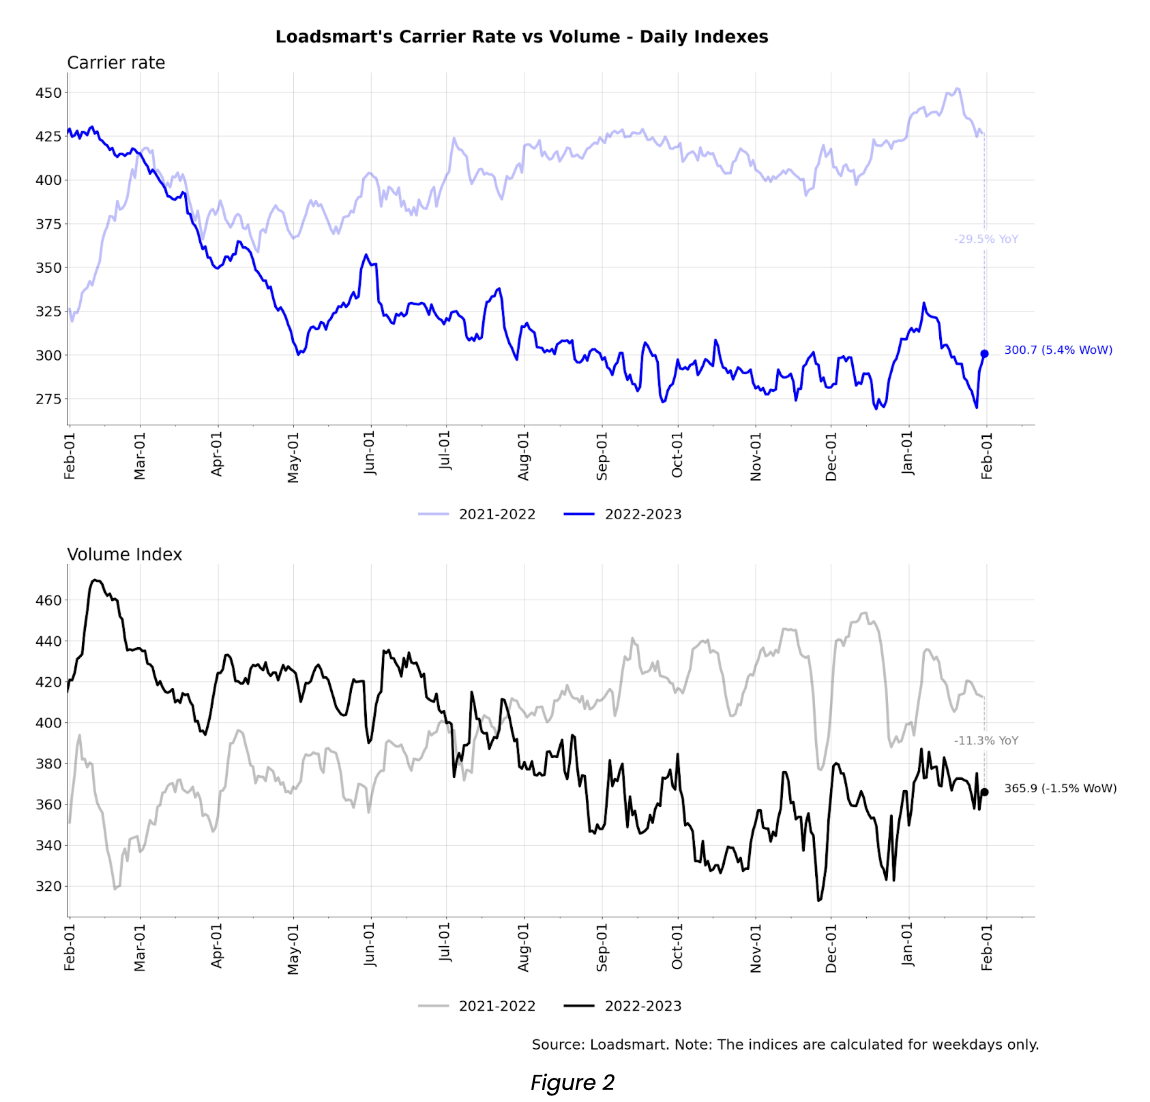
Our price index decreased by 4% in January (day 01 to 31). Prices peaked in the first week of the month – likely still boosted by the holiday season’s tightened capacity; then they fell back to December 2022’s floor, and mildly recovered after. The first week’s price surge was sharper in the West (California, Oregon, Colorado, and Utah), where prices hit their highest level since October 2022.
Loadsmart’s Look Ahead:
Contract rates & spot floor: As we have mentioned in the past few monthly updates, we expect the spread between contract rates and spot rates to shrink over the next two quarters. Not only are network bids resetting contract rates 15%+ lower YoY on average (pulled from Loadsmart bid data), but we also believe spot rates have hit their floor for 2023.
- Loadsmart is currently forecasting that the December & January spot rate lows represent the spot rate floor for this down market cycle, but this could change if volumes were to plummet in the back half of Q1 (potentially as a result of economic slowdown).
- Of course, as spot rates slowly start to inch up throughout Q2/Q3 (as we’re currently forecasting), this will draw the contract vs spot spread even closer.
Freight & Economics
Retailers Inventory-To-Sales Ratio
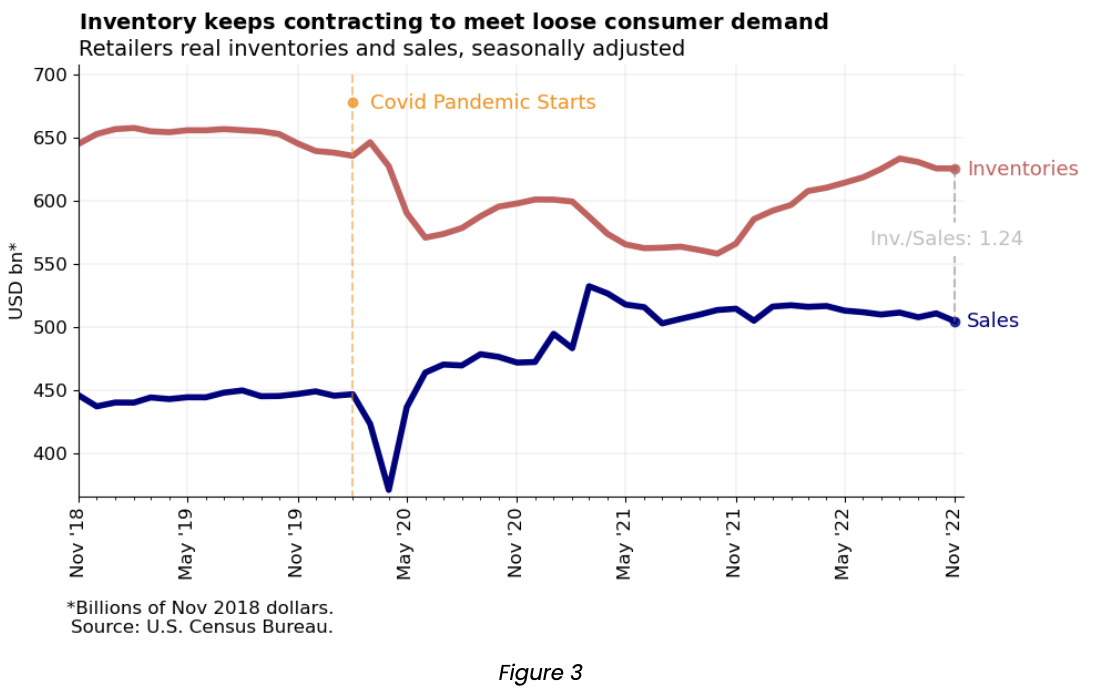
- November data reveals that retail inventory levels remained constant MoM but are down 1.2% from their 2022 peak reached in August- Figure 3.
- 2H 2022 was marked by a shrinkage in inventory levels as stores doubled down their efforts to clear up inventory amidst recession fears – stemming from worries that high inflation and credit card delinquency rates rising may dampen personal consumption in 2023.
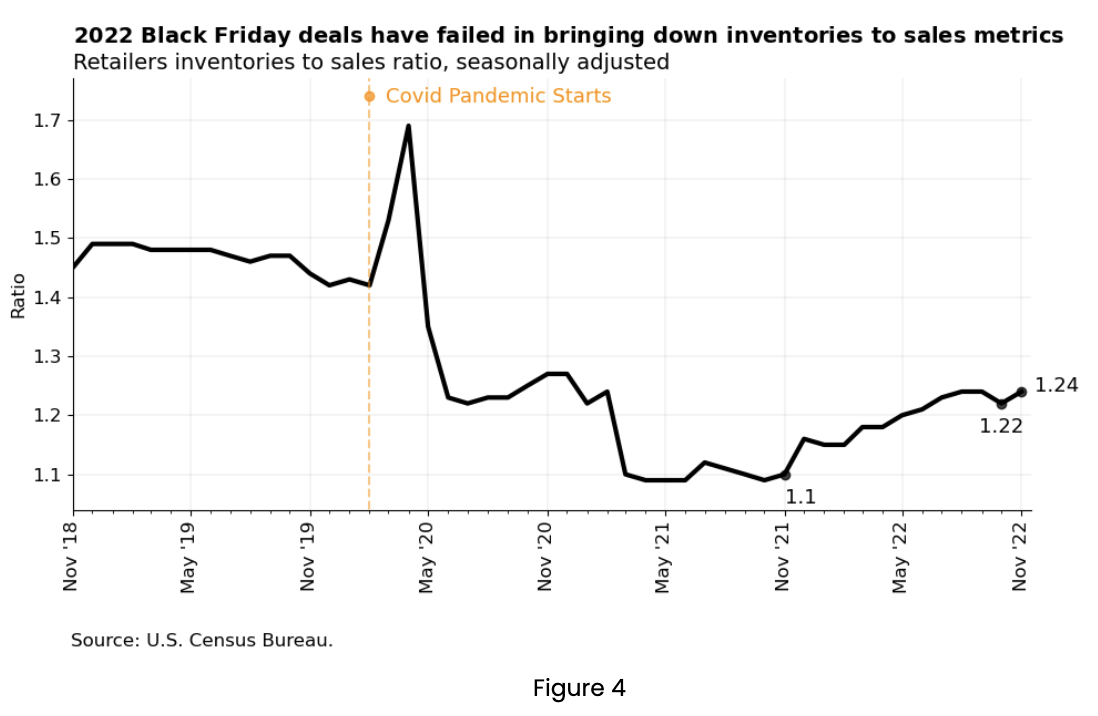
- But, despite retailers’ efforts to bring down inventories and lower the inventory to sales ratio, the ratio has remained consistently high since August – Figure 4.
- In October there was a small dip in the index from 1.24 to 1.22, but in November it returned to 1.24 – in line with August’s level. Inventory to sales is up 13% YoY although its current level is still far behind pre-pandemic ratios.
- The ratio is not expected to get back to its pre-pandemic levels because supply-chain management developments are making retailers more capable of quickly adjusting the mismatches between demand and inventory availability, without the need of piling up excessive inventory.
We predict another increase in inventory to sales metrics as the Advance Retail Sales Survey reported a decline in sales for December – which suggests that holiday deals were not enough to provoke a shopping spree large enough to take significant inventory off the shelves.
Industrial production
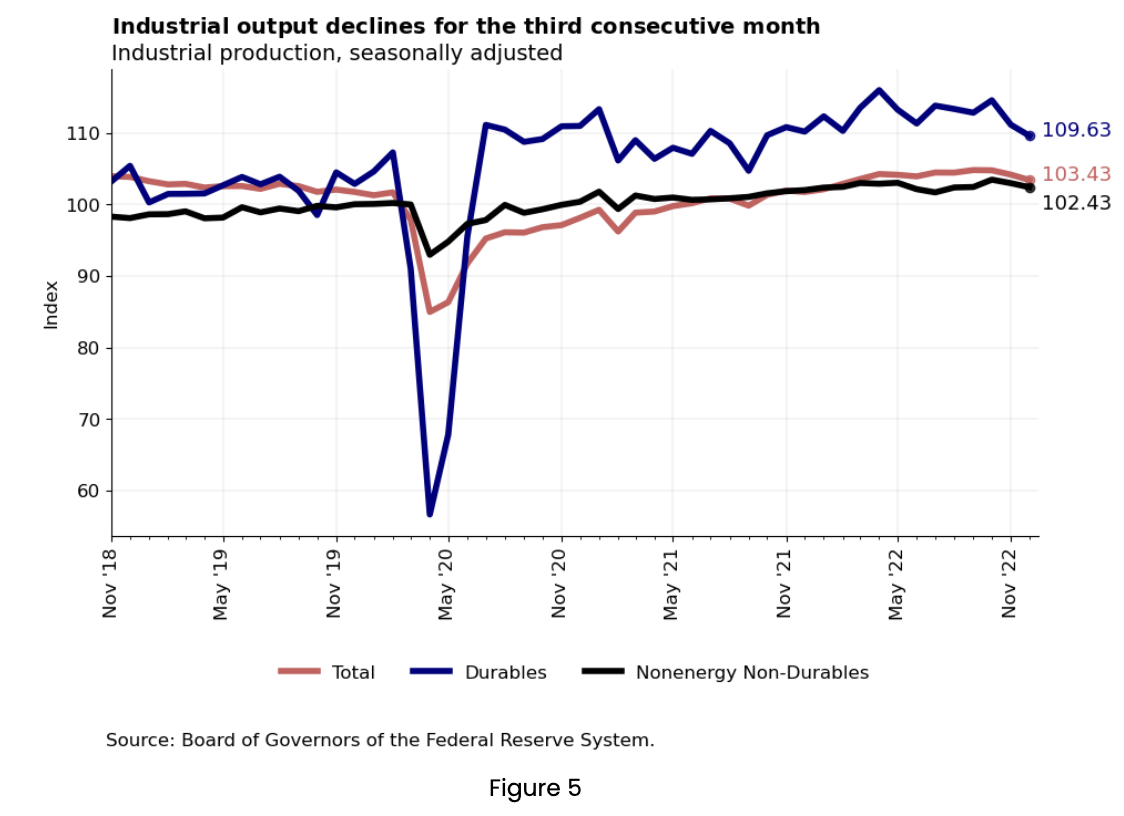
Industrial production slumped 0.7% MoM. The index has been declining since September 2022, potentially due to weaker consumer demand. As expected, the fall in production was more pronounced for cyclical sectors, which are more likely to have their consumption postponed during recessions: durable goods output fell 1.3%, while non-energy nondurable goods production fell only 0.5% – see Figure 5.
For the truckload market, the slowdown in manufacturing suggests further declines in freight volumes in the near term.
On the positive side, however, this is another indication that diesel prices will continue to drop in the coming months due to an excess of oil supply over demand (see the latest EIA forecast).
As always, please reach out to Stella Carneiro (stella.carneiro@loadsmart.com) with any questions, suggestions, thoughts, etc. Thank you!
------------------------------------------------------------------
For more about how you can understand the current market to plan for the future, download our quarterly report.