Share this
by jpallmerine
As usual, in this Monthly Market Update, we will provide a brief update & analysis of the full truckload market and present some compelling trucking-related economic analysis to provide a macroeconomic view on the state of the market. Please reach out to Stella Carneiro (stella.carneiro@loadsmart.com) with any questions, suggestions, thoughts, etc. Thank you! We hope you enjoy! #movemorewithless

- The 3-month smoothed rate increased in November, reflecting the significant increase in the average monthly rate in September.
- But the deceleration is notable. The rate grew by about 5% per month from August to October, but growth has halved from October to November.
- In the first quarter of '24, we expect the rate recovery cycle to slow a bit more, as January through March is typically a slow season for freight.
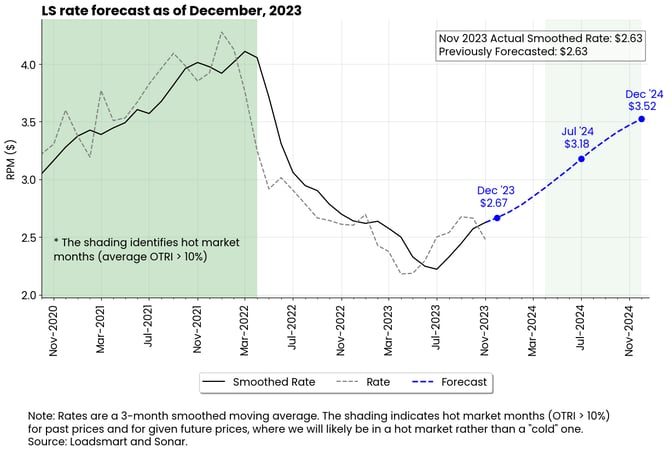
Figure 1
November's Full Truckload Market Review:
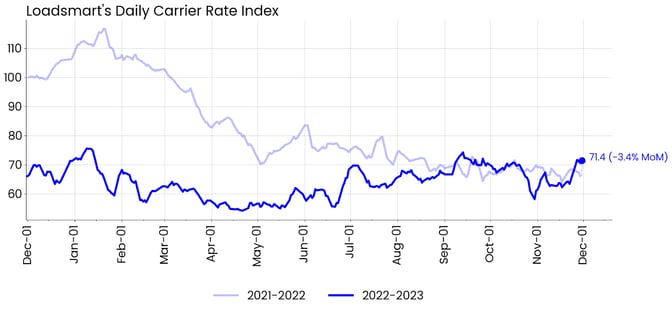
Figure 2
Rates: Our price index declined 3.4% MoM. Our prices partially recovered from October's sharp decline in early November. However, it was not until the week before Thanksgiving that they jumped.- Prices surged 15% three days before the holiday, in line with in previous years.
- These temporary price spikes during the holidays indicate that capacity is tightening as, unlike last year, rates have reacted to temporary surges in demand - see Figure 3.
- Sonar's OTRI behaved similarly to our index - it had a weak start to the month, followed by a rebound during the week leading up to the holidays.
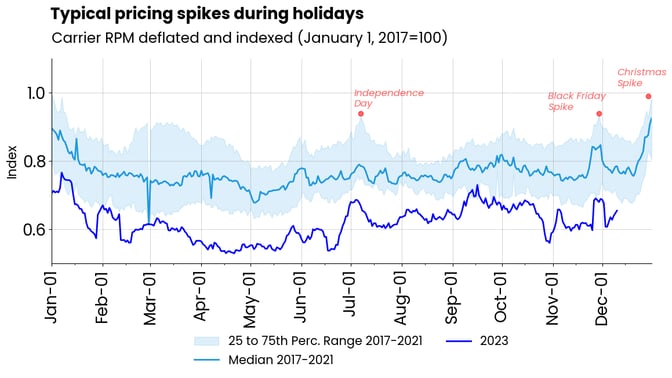 Figure 3
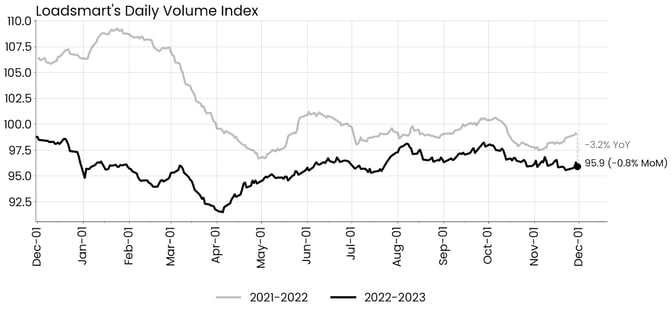
Figure 4
Volumes: Our volume index was down 0.8% MoM in November. Since the beginning of October, our volumes have been on a slight downtrend.- In contrast to our index, Sonar's OTVI increased in November on a MoM basis and reached its YTD high in the days leading up to the holidays.
Loadsmart’s Spot Rate Forecast Then & Now:
Figure 5 shows how our forecast evolved over the year. In June, when we first started our forecast, we predicted that the recovery would begin in that month, but it took a month longer.
After that, as we had predicted, there was a steady recovery in prices, but this rebound was better than initially expected. This is due to:
- The unexpected increase in diesel prices at the end of August - as our rate calculation includes fuel surcharges.
- The strong performance of consumer spending (especially durable goods) in Q3 2023. Our forecast model uses past consumer spending to predict future rates.
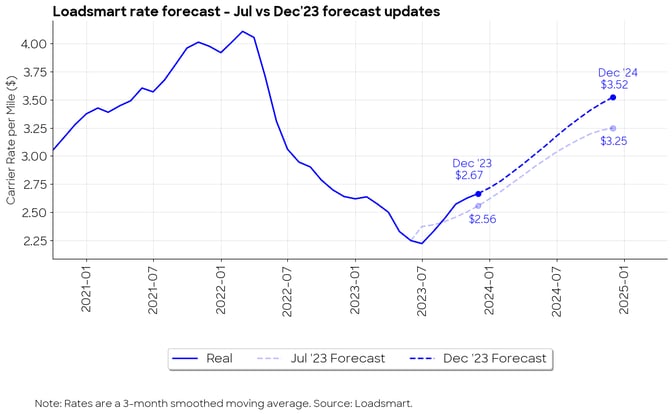 Figure 5
Freight & Economics Review
Contract-to-spot spreads
We reformulated our contract-to-spot indicators to make a fair comparison between the two markets. The sample that generated Figure 6 was compiled so that for each contracted shipment, we look for a spot one with a similar origin, destination, and date.
This shows that the recovery in spot rates is still very small in markets where our contract presence is greater.
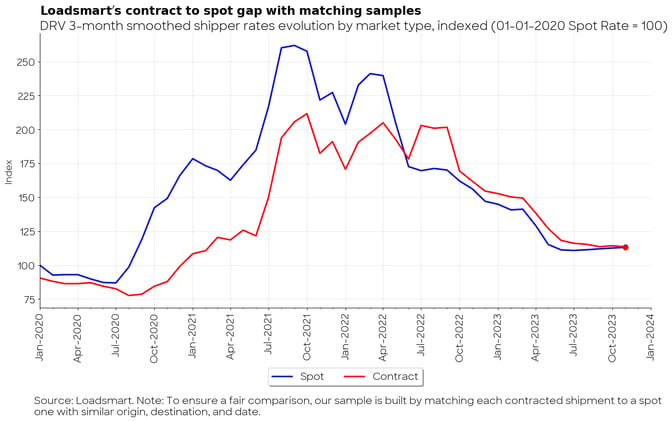
Figure 6
The weak recovery in spot rates in regions where we have more contracts has pushed contract rates to their lowest levels since January 2021, and average contract-to-spot spreads to zero.
This still leaves shippers in a good position to downplay the market in the upcoming bidding season. As a result, we do not expect contract rates to rise in Q1 2024.
The year ahead for consumer spending
The Conference Board Economic Forecast report, released on November 15, predicts that consumer spending will shrink in Q1 2024 and Q2 2024.
As shown in Figure 7, consumption is expected to decline by 1% QoQ in the first two quarters and then grow by 1.1% and 1.8% QoQ in the following ones.
- If this happens, it will be the first time since Q2 2020 that we will see a decline in real consumer spending.
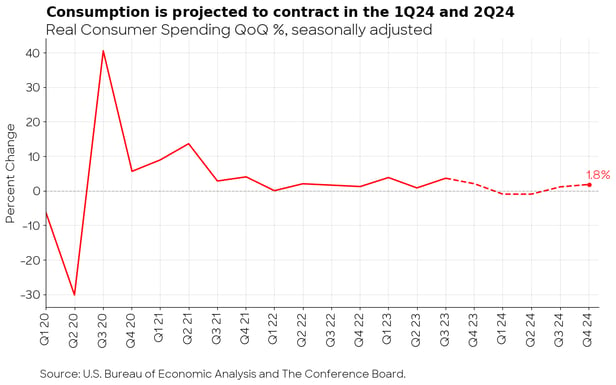
Figure 7
According to the report, U.S. consumer spending has held up remarkably well this year despite higher inflation and interest rates. However, they believe that this trend may not be sustainable as household excess savings dwindle and consumer debt rises.
The recovery in our forecast already takes into account the negative scenario for freight demand next year. Since we have started our rate forecast, we have stated that the recovery in rates would be gradual and modest, mainly because it would be synchronized with the adjustment in supply (i.e. more carriers exiting the market) rather than a surge in demand.