Share this
by jpallmerine
As usual, in this Monthly Market Update, we will provide a brief update & analysis of the full truckload market and present some compelling trucking-related economic analysis to provide a macroeconomic view on the state of the market. Please reach out to Stella Carneiro (stella.carneiro@loadsmart.com) with any questions, suggestions, thoughts, etc. Thank you! We hope you enjoy! #movemorewithless

Loadsmart’s top 30 spot rate forecast
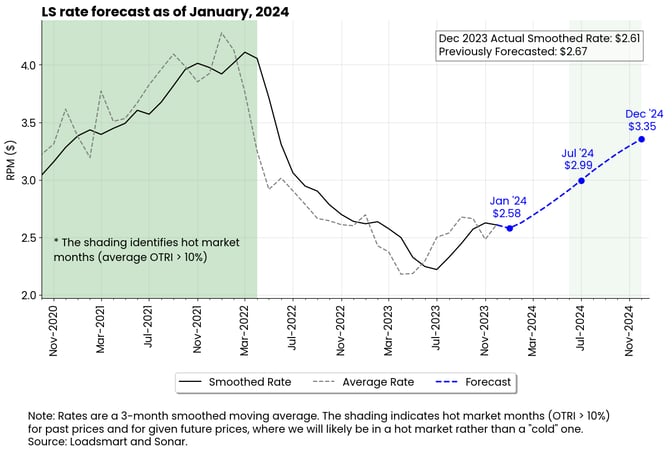
Figure 1
Our model predicts that spot rates will decline from $2.61 in December to $2.58 in January.- The 3-month smoothed rate used in the forecast declined in December due to the negative performance of the October and November average rates.
- This deceleration of rates in Q4 2023 impacted our prospects of recovery for next year.
- The model calls for another rate drop in January and a further slowdown in the recovery cycle.
Full Truckload Market Overview:
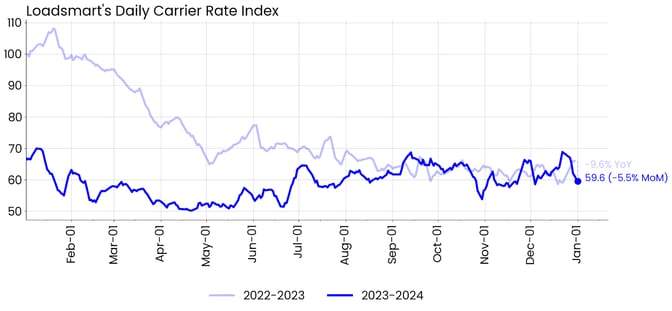
Figure 2
Rates: Our price index declined 5.5% MoM in December. Prices followed an upward trend in early to mid-December, but declined thereafter.- In 2023, the Christmas-related price peak was earlier than normally expected, as shown in Figure 3. The prices reached their highest level around the 18th, whereas in the previous years they continued to rise into the New Year's eve.
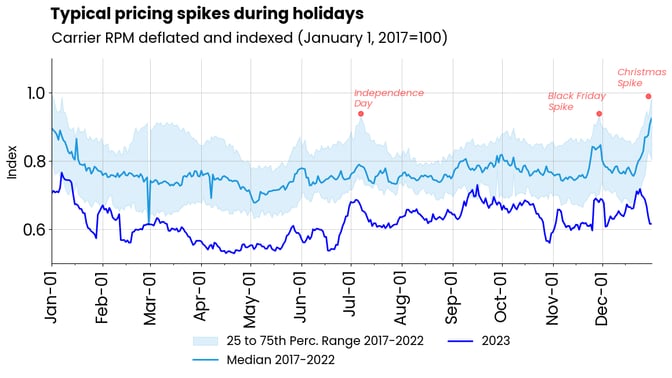 Figure 3
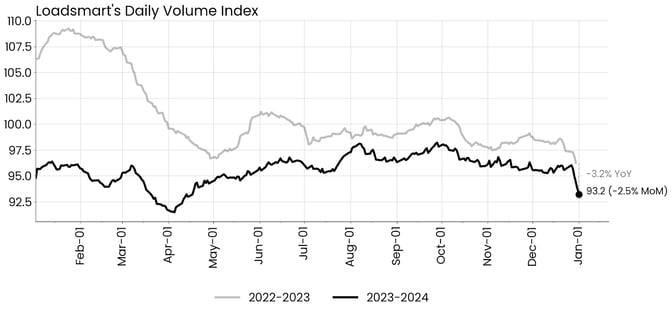
Figure 4
Volumes: Our volume index was down 2.5% MoM in December. We have observed a similar seasonal behavior in the volume curves of '2022 - 2023' and '2023 - 2024' in December, with a typical drop in freight volumes after the second week of the month.- Sonar's OTVI has followed a similar trend during December, dropping over 50% from the second to the fourth week of the month.
Freight & Economics Review
Red Sea attacks to pressure global supply chains
The Israel-Gaza war has started to impact supply chains, which could be reflected in domestic freight inflation in the coming months. This is because one of the regions at the center of the conflict is the Suez Canal, through which one-third of the world's containerized cargo passes.
Commercial vessels passing through the Suez Canal are being targeted by Houthi rebels in response to Israel's bombardment of Gaza - prompting shipping lines to halt all cargo traffic through the area.
Shipping insurances do not cover wartime attacks. So to avoid losses, shipping companies are forced to change their routes and go through Asia to the West, around Africa and the Cape of Good Hope.- The 7-day moving average of cargo ships circulating on the Suez Canal has fallen 15% MoM and transit trade volume is down 17% MoM (as of 01-08-2024, see Figures 5 and 6).
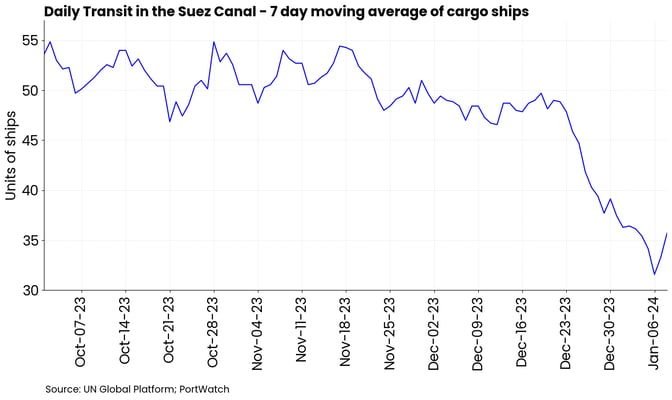
Figure 5
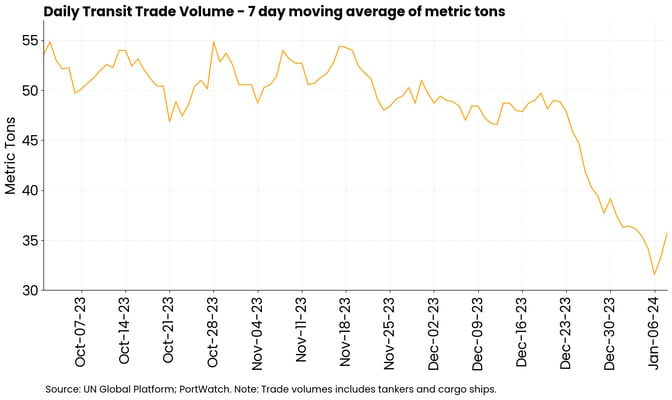
Figure 6
While 7-day moving average of cargo ships circulating on the Cape of hope has rose 48% MoM (as of 01-08-2024, see Figure 7).
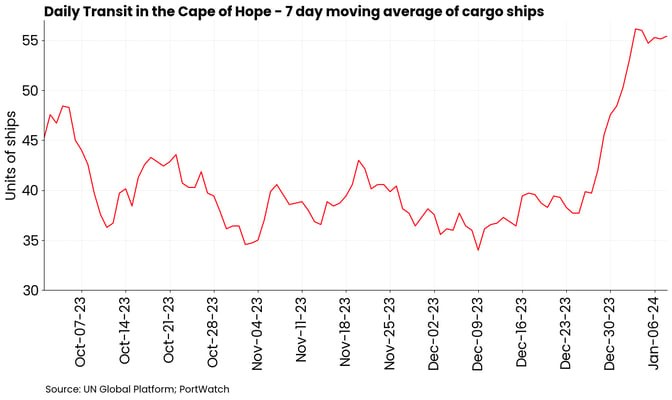
Figure 7
The rerouting of vessels is leading to longer transit times and increased costs.
U.S. retailers seeking to avoid stocking delays are asking freight brokers to bypass the Panama (where routes are limited due to drought) and Suez Canal and ship goods across the Pacific Ocean to California, where they can be transported by rail or trucking to the East Coast.
- If the situation continues, we expect to see an increase in truck/intermodal demand out-bounding from the West Coast.
- The conflict's impact is small for now, given that it comes at a time when demand for imported goods is falling and inventories are high.
The state of capacity
2023 ended with the capacity situation still on a slow correction. The decline in the number of carriers in the freight market has been practically linear from September 2022 until now - from 387k to 356k as seen in Figure 8.
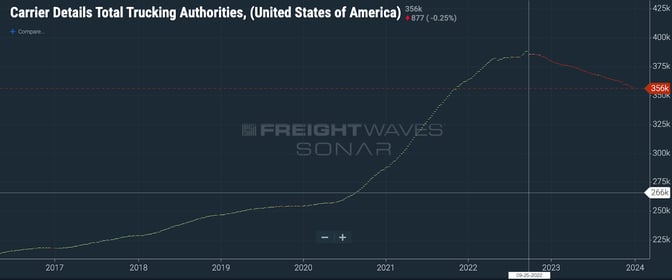
Figure 8
We expect an acceleration of this correction in Q1 2024, as demand is seasonally lower at this time of the year and operating expenses increase with annual revisions of licenses, insurance and taxes.- The period between January and March is known for being the quiet shipping season, where freight volumes are usually lower than the rest of the year.
- The increase in operating costs, especially for small, financially constrained fleets, may accelerate their exit from the market, even with the expectation that payroll and fuel costs will be stable in this first quarter of the year.