Share this
As usual, in this Monthly Market Update, we will (a) provide a brief update/analysis of the full truckload market and (b) present compelling economic analysis to provide a macroeconomic view on the state of the freight market.
We hope you enjoy! #movemorewithless
Loadsmart’s top 30 spot rate forecast
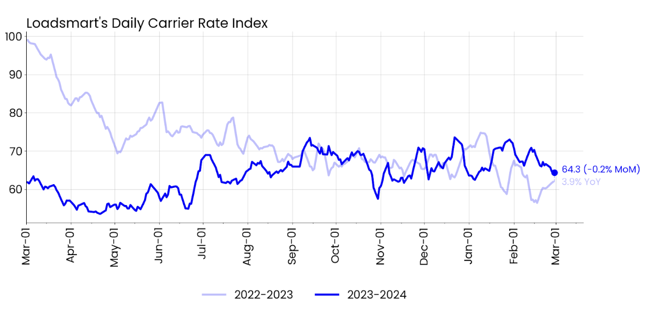
Figure 1
Rates: Our price index fell 0.2% MoM in February. Our price index began the month fluctuating, still maintaining the gains it had made in January; but halfway through the month, the index plummeted.- The decline was not universal, with prices falling 8% and 10% in the Southwest and Midwest, respectively, and rising slightly in the West, Midwest; and Southeast - about 2% in each region.
- Sonar's OTRI also plummeted in February. The rejection rate started the month at 5.3% and ended the month at 3.7%.
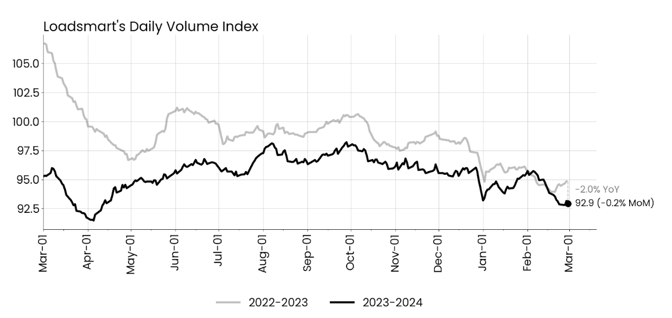
Figure 2
Volumes: Our volume index dropped 0.2% MoM in February. At the beginning of the month, our volumes returned to December levels and for the first time this year, we posted year-on-year gains. However, volumes declined throughout the month.
Sonar's OTRI was up 2.5% for the same month. Volumes declined in the first two weeks of February but later recovered towards the end of the month.
- Spot rates had recovered from the July low in 2H2023, reaching $2.62 in November, but have been flat since early 2024;
- The uptrend in prices should resume in April. Prices are expected to relach $2.79 in July and $3.11 in December 2024, and continue to rise until May 2025, when prices peak at $3.23, 27% below the March 2022 high.
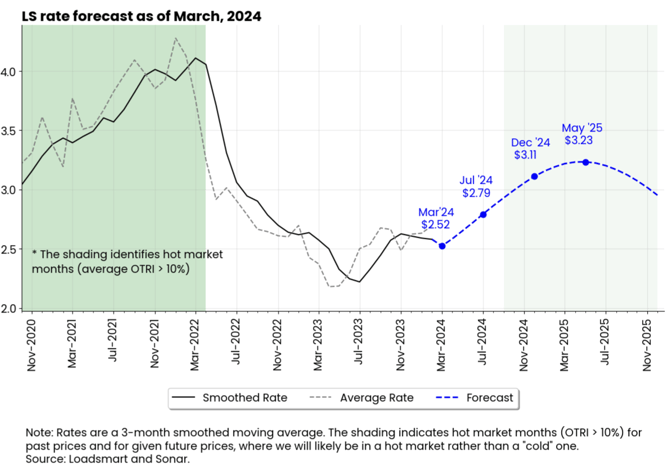
Figure 3
Freight & Economics
Rising diesel prices contributed to carriers' financial distress in Feb
- The average price of diesel rose from $3.85 to $3.92 in February and is expected to rise further to $4.02 in March, according to the EIA, as shown in Figure 4.
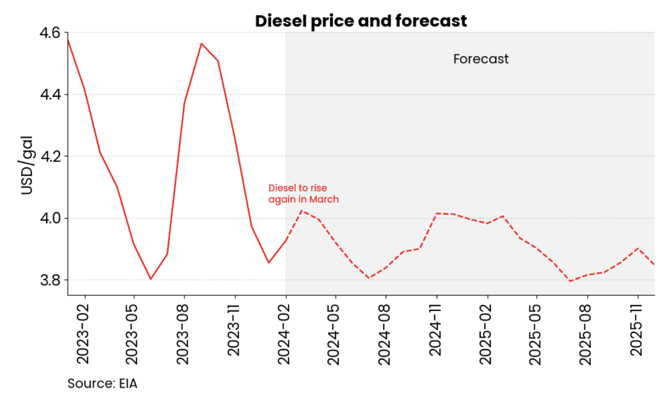
Figure 4
- The decline in U.S. oil production led to the price increase. Refinery utilization fell from 93.50% (Dec-29) to 81.50% (Feb-23) due to reduced plant operations in both the Midwest and Gulf Coast. Activity was reduced in both regions given the cold weather and routine maintenance.
- The sudden spike in diesel prices will weigh on carriers' financial performance in 1Q2024. All-in spot rates are declining despite the rise in fuel surcharges, which suggests that linehaul-only rates are dropping even further. According to Loadmart's price index, linehaul-only rates dropped back to October '23 levels at the end of February, as shown in Figure 4.
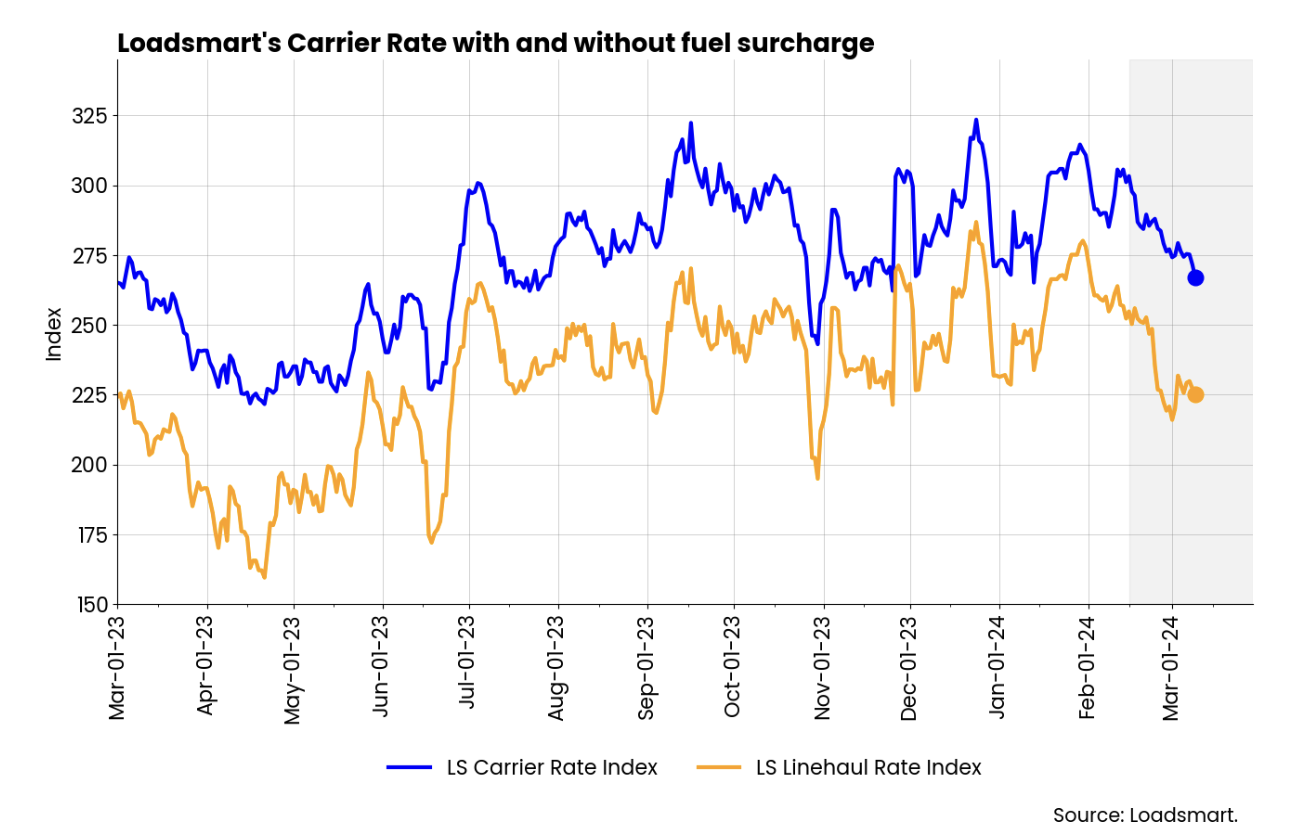 Figure 5
Cargo volumes are expected to rise throughout the 1H2024
- January cargo volumes were up 8.6% YoY and they should continue to show gains relative to their YoY comps, according to Global Port Tracker. Volumes are expected to rise 7.8% total in the 1H2024 - Figure 6.
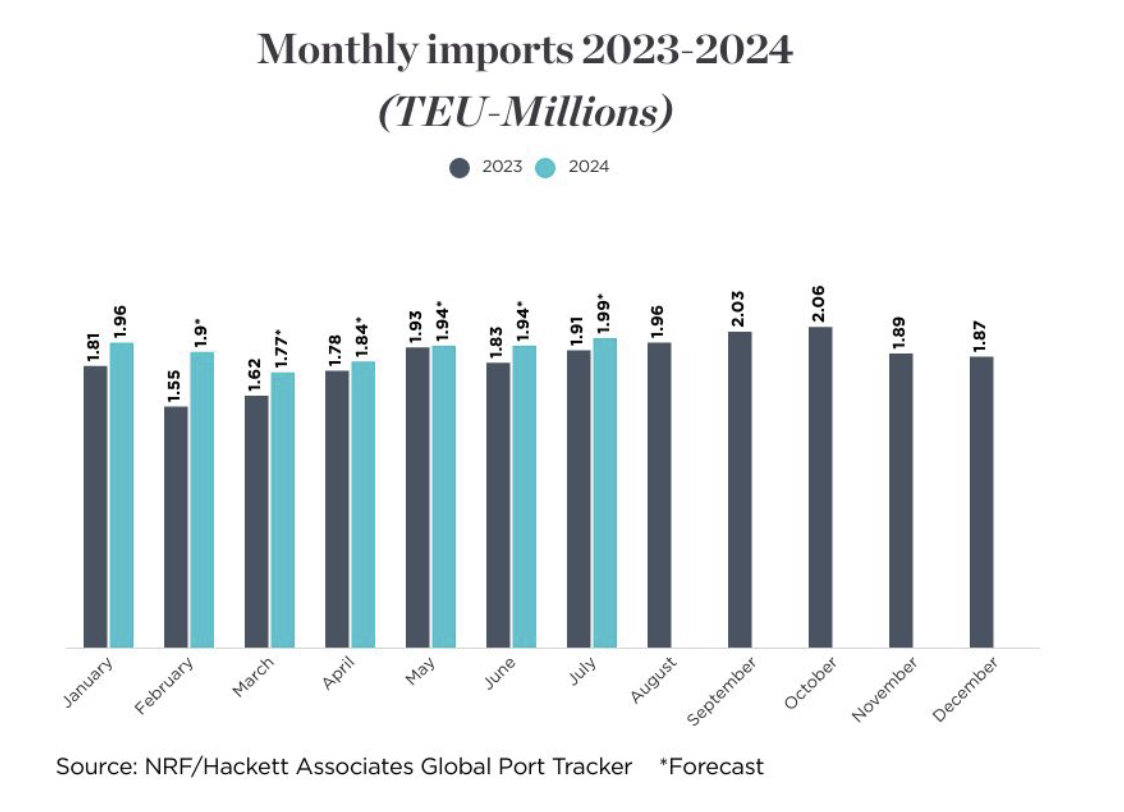
Figure 6
- The increase in import volumes compared to 2022 comes despite worsening global supply chain pressures and higher shipping costs compared to last year. Freighto's Baltic Index more than doubled at the beginning of the year due to reroutings made to avoid the Red Sea corridor after the Houthi attacks began.
- As capacity adjusted to the new routes, ocean freight rates began to decline again in February. But if Global Port Tracker's predictions are correct, an increase in the volume of imports into the U.S. could eventually cause rates to stabilize at higher levels than last year.
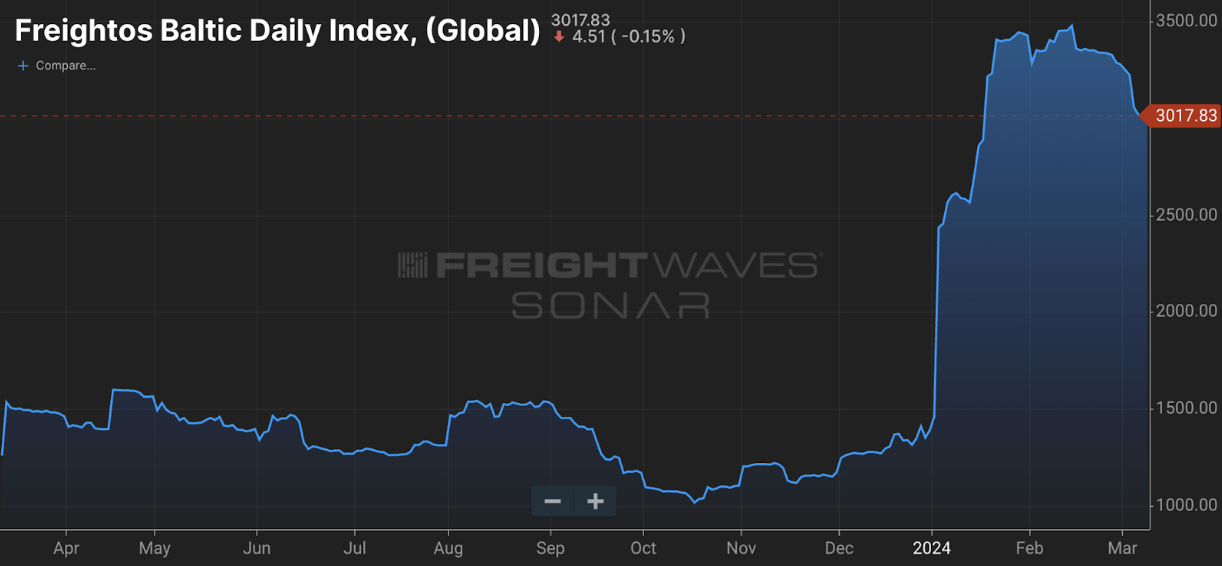
Figure 7
Please reach out to Stella Carneiro (stella.carneiro@loadsmart.com) with any questions, suggestions, thoughts, etc. Thank you!