Share this
by jpallmerine
Warehouses are the central nodes in the logistics network, and understanding the trends in this industry is key for carriers. In this article, we explore the two main trends that arose from warehousing’s adaptation to the e-commerce era, which are (i) spatial decentralization - the movement of facilities away from urban to sub/exurban areas; and (ii) the densification of logistics networks.
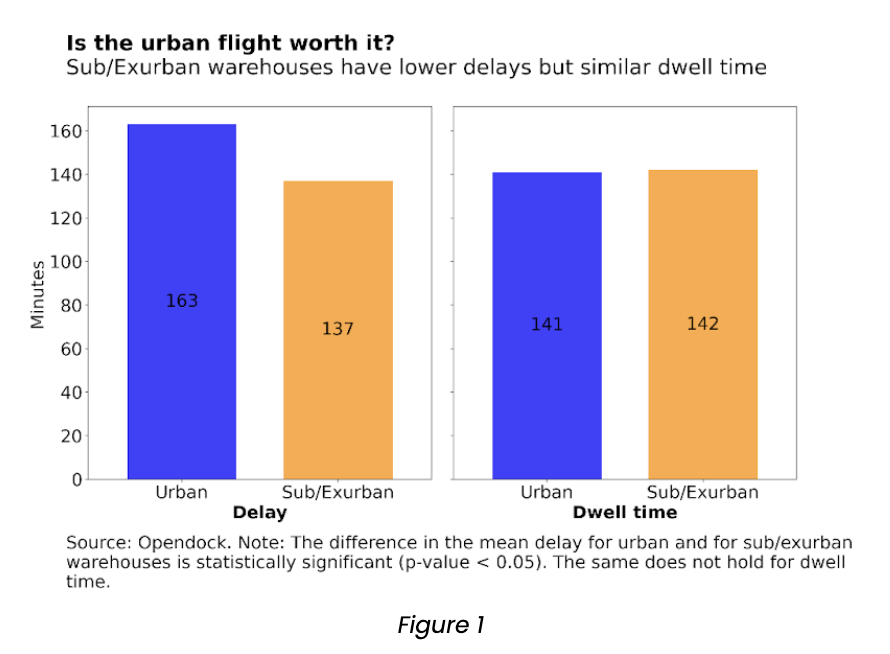
In a nutshell, we find from our data that:- Warehouses in sub/exurban areas are more efficient because truck arrival delays are, on average, 26 minutes lower at these facilities;
- Freight operations are still concentrated in urban areas but this is slowly changing;
- Companies are moving their warehouses away from core consumer markets, the city centers, but also densifying their logistics networks. This means that, although last-mile haul distances might be increasing, first and middle-haul distances are decreasing.
Spatial Decentralization
The pandemic-driven e-commerce boom has transformed the warehousing industry in the U.S. The surge in demand for home deliveries enabled retailers to sell items at a reduced cost because, on a per-sales basis, the cost of operating distribution centers in peripheral areas is lower than the cost of operating stores in central areas - see this article for additional info on online retailers’ geography. Also, suburbs tend to have less traffic congestion and better supply chain connectivity as they have more road infrastructure to support regional and national flows with their easy access to state and interstate highways.
To analyze and understand these trends, we examine Loadsmart's proprietary data. Fortunately, we did not have to look very far, thanks to Opendock, our cloud-based dock scheduling solution. In addition to increased visibility for shippers & reduced detention fees for carriers, Opendock allows us to gather, and analyze data at the warehouse level.
Opendock has over 100,000 carrier users, scheduling 10 million annual appointments in 3,000 warehouses and distribution centers. By leveraging this data, we define whether a facility is urban or sub/exurban based on its location; if the facility is within an area classified as urban by the 2020 Census (1), we define it as such. From this data split, we learned that truck delays (the time between scheduled appointment time and actual arrival) are on average 26 minutes longer in urban facilities, possibly given city-center traffic; while the average dwell time (time between actual arrival and drop-off or pick-up completion) is similar for both - Figure 1.
Densification of Logistics Networks
As facilities move farther away from urban markets, one would expect the average mileage per shipment to increase; which may just be the case for last-mile shipments, but not for first and middle-mile shipments (manufacturer to warehouse and warehouse to warehouse, respectively). This is because shippers are rapidly adjusting to the online shopping boom by building denser distribution networks. A recent article that looked at changes in Amazon's distribution network found that the company reduced its average mileage per shipment from 450 to 141 miles in the 1999-2018 period, thanks to its network densification.
Loadsmart Quote Data
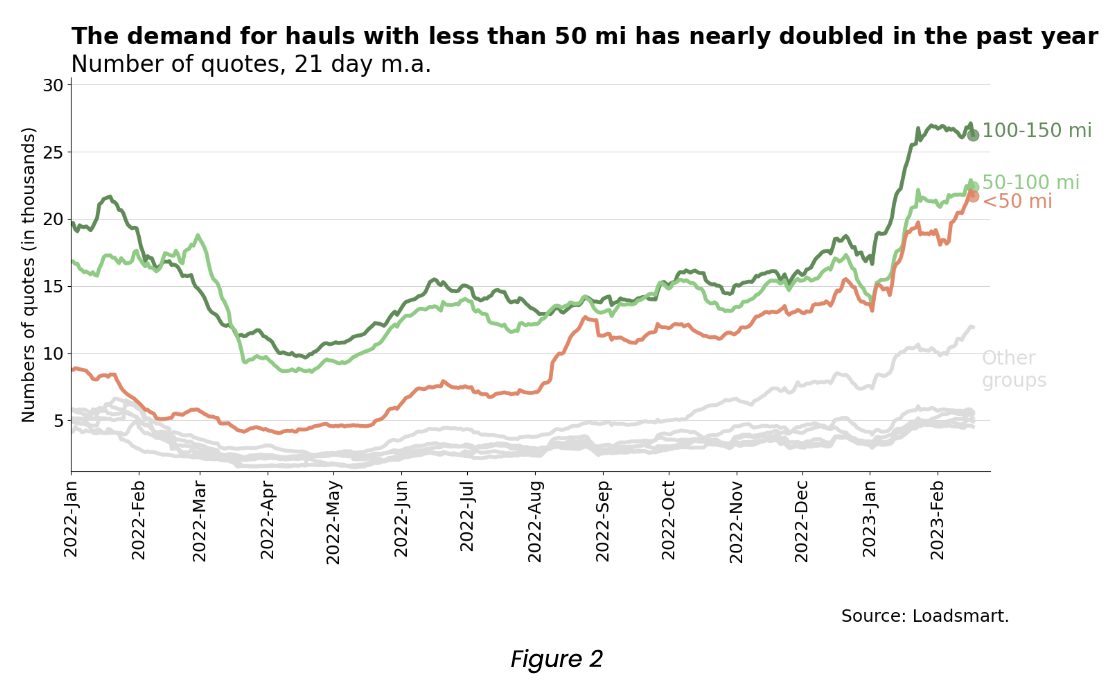
We observe these same two trends in Loadsmart's quote data: (i) the share of quotes for freight with pick-ups in sub/exurban areas rose from 26% to 30% during 2022 (2); (ii) and distance-wise, the demand for shorter hauls grew the most over the same period - Figure 2. The combination of these two trends is forcing carriers to reconfigure their operations by working with shorter distances within cities’ fringes.
By examining Opendock's facility data, as well as the vast amount of quote data from our TMS integrations, we found evidence of both warehousing decentralization and densification. We believe these trends should benefit carriers in the long run, as shorter hauls and fewer delays should allow for more trips per day.
1. Check here the criteria used for the 2020 Census territory classification.
2. This means that 74% of Loadsmart quoted freight is still from urban to urban areas.