Share this
As usual, in this Monthly Market Update, we will provide a brief update & analysis of the full truckload market and present some compelling trucking-related economic analysis to provide a macroeconomic view on the state of the market. Please reach out to Stella Carneiro (stella.carneiro@loadsmart.com) with any questions, suggestions, thoughts, etc. Thank you! We hope you enjoy! #movemorewithless

Loadsmart’s top 30 spot rate forecast
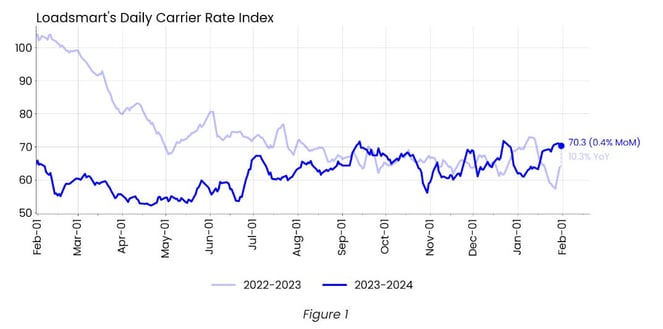
Rates: Our price index fell 0.4% MoM in January. Our price index began January with a sharp drop that followed the Christmas holiday. However, after January 15th, prices rebounded and our rate returned to a level similar to December's peak.
- One hypothesis to explain the mid-January price jump is seasonal capacity tightening due to winter storms, but we do not see a direct causal relationship between rate spikes and the storms. The mid-January price spike was largely driven by rate spikes in the Midwest, Ohio, and Indiana, where rates rose above Christmas levels. However, there were no price spikes in the Mid-Atlantic and Northeast regions, which were hit hardest by winter storms during the period.
- Sonar's OTRI also rebounded in mid-January.
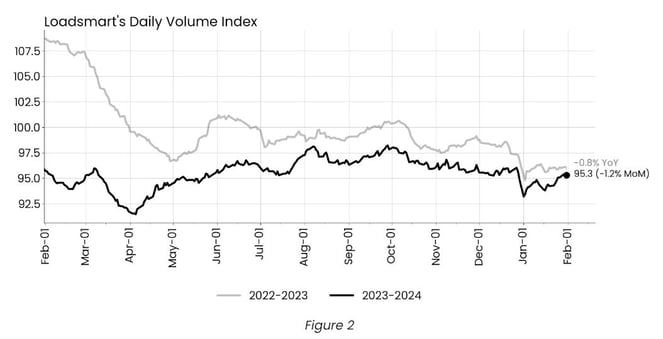
- Sonar's OTVI, on the contrary, has recovered, with volumes rebounding to December levels in the first week of January and remaining elevated throughout the month. The OTVI is up approximately 10% YoY.
Loadsmart’s Spot Rate Forecast
While the average rate was unchanged from Dec to Jan, the 3-month smoothed rate declined in Jan due to the negative performance of the average rate in November.
Rates should reach $3.03 by Jul and $3.4 by Dec 2024;
The uptrend should continue through May 2025, when prices will peak at $3.55, 13.6% lower than the Mar 2022 high.
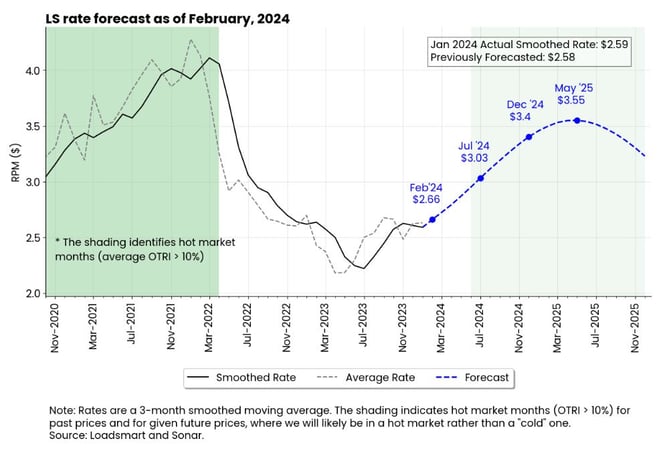
Figure 3
Freight & Economics Review
Deflation in the goods sector is a bullish sign for freight activity
The pandemic caused a shift in consumer spending from services to goods, and after almost three years there is still no rebalancing of the household consumption basket. Consumption of goods is still well above its pre-pandemic trend, while consumption of services is below it - see Figure 4.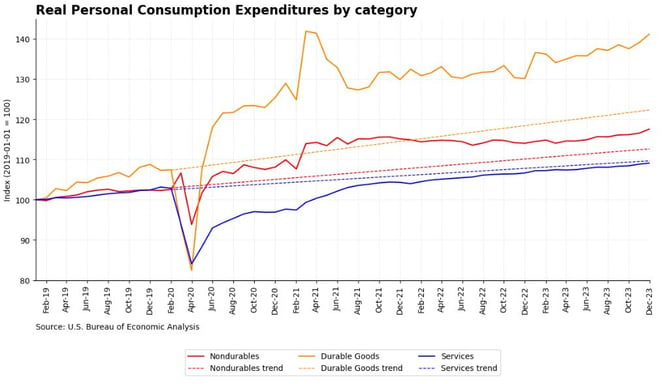
Figure 4
But we continue to believe that the slowdown in goods spending and the reallocation of spending from goods to services will finally begin in 2024. But it will be driven not by a real decline in demand for goods, but by the deflationary process that this category is undergoing - see Figure 5. As the price of goods deflates, the dollar amount spent on goods and its weight in consumers' budgets can fall, even if the demand for goods is still rising in terms of volume.
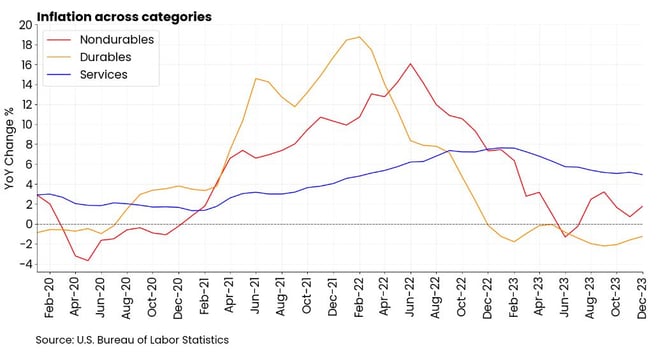
Figure 5
- Deflation is currently affecting only a few durable goods categories - such as motor vehicles, home furnishings and recreational goods - but with the decline in commodity prices, non-durable goods are also expected to enter deflationary territory in 2024.
- For the truckload market, the potential slowdown in consumer spending in 2024 may not mean less volume to ship.
Industrial production recovery signs
The U.S. manufacturing sector showed signs of recovery in January as manufacturing activity expanded for the first time since April 2023, according to the latest PMI® data from S&P Global.
The manufacturing index stood at 50.7 in January, up from 47.9 in December - see figure 7. A PMI reading above 50 indicates that the manufacturing sector is entering ana expansion zone, as more purchasing managers surveyed reported an increase in activity, compared to those who reported a decrease, over the previous month.
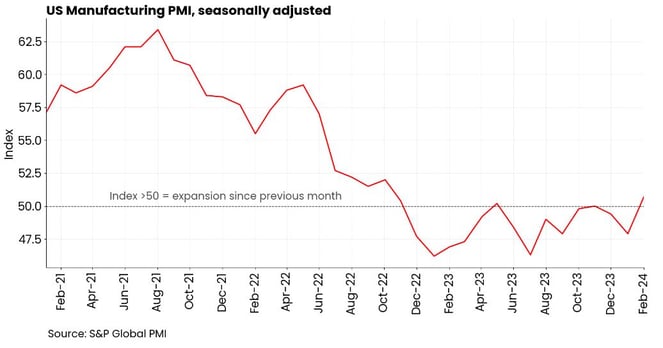
Figure 6
According to the report, the increase was driven by renewed growth in new orders at manufacturing firms. But the improvement in demand is domestically focused as new export orders continue to decline.
Despite the growth in new orders, producers output declined in January given transportation delays and severe storms.