Share this
Loadsmart’s Look Ahead: An Analysis of Key Freight & Economic Indicators to Watch in July
by jpallmerine
As usual, in this Monthly Market Update, we will provide a brief update & analysis of the full truckload market and present some compelling trucking-related economic analysis to provide a macroeconomic view on the state of the market.

Long-Term Spot Rate Forecast
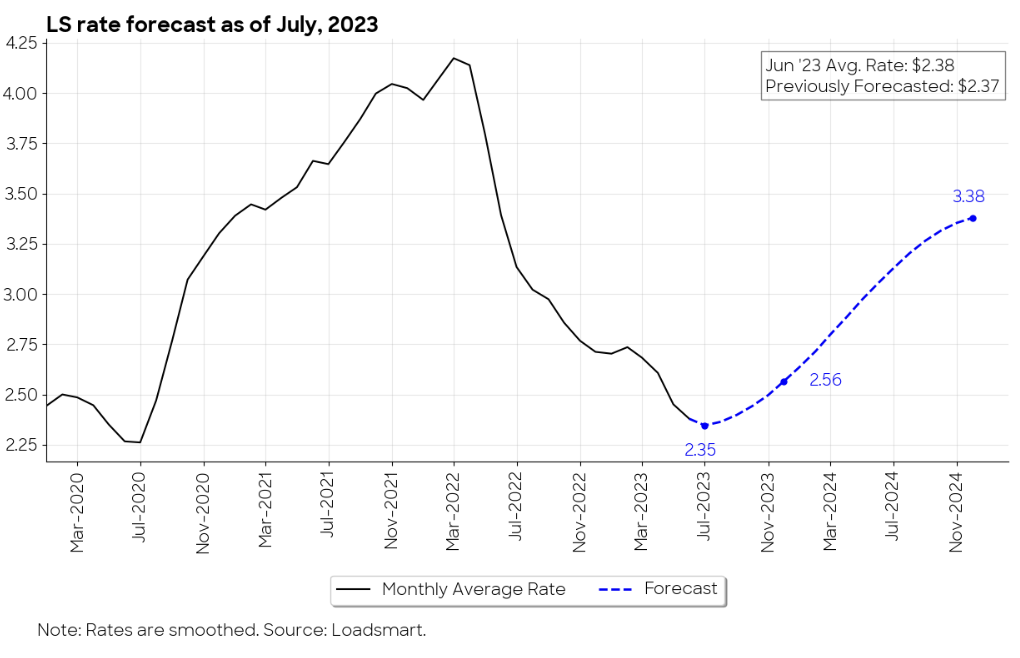
In this month's publication, we're happy to add a new section to our Monthly Market Update. We are now publishing Loadsmart's long-term spot rate forecast - shown in Figure 3 below. The results are derived from our predictive model, which combines internal data with key macroeconomic indicators and forecasts.

- As of July 1, 2023, our model predicts that the monthly average spot price should finally bottom out in July, falling from the June average of $2.38 to $2.37 in July only.
- Given the current economic outlook of declining consumption and industrial production, the model forecasts a mild recovery starting in August. This turnaround will be largely driven by the fact that capacity tightening has reached its limit, i.e. enough carriers have exited the market to rebalance supply & demand (stemming from extremely low spot & contract rates and lower overall freight volume).
By the end of 2023, our forecast predicts that rates will rise to $2.56 (a 9% increase from July’s forecasted bottom) and continue on an upward trajectory through 2024.
June's Full Truckload Market Overview:
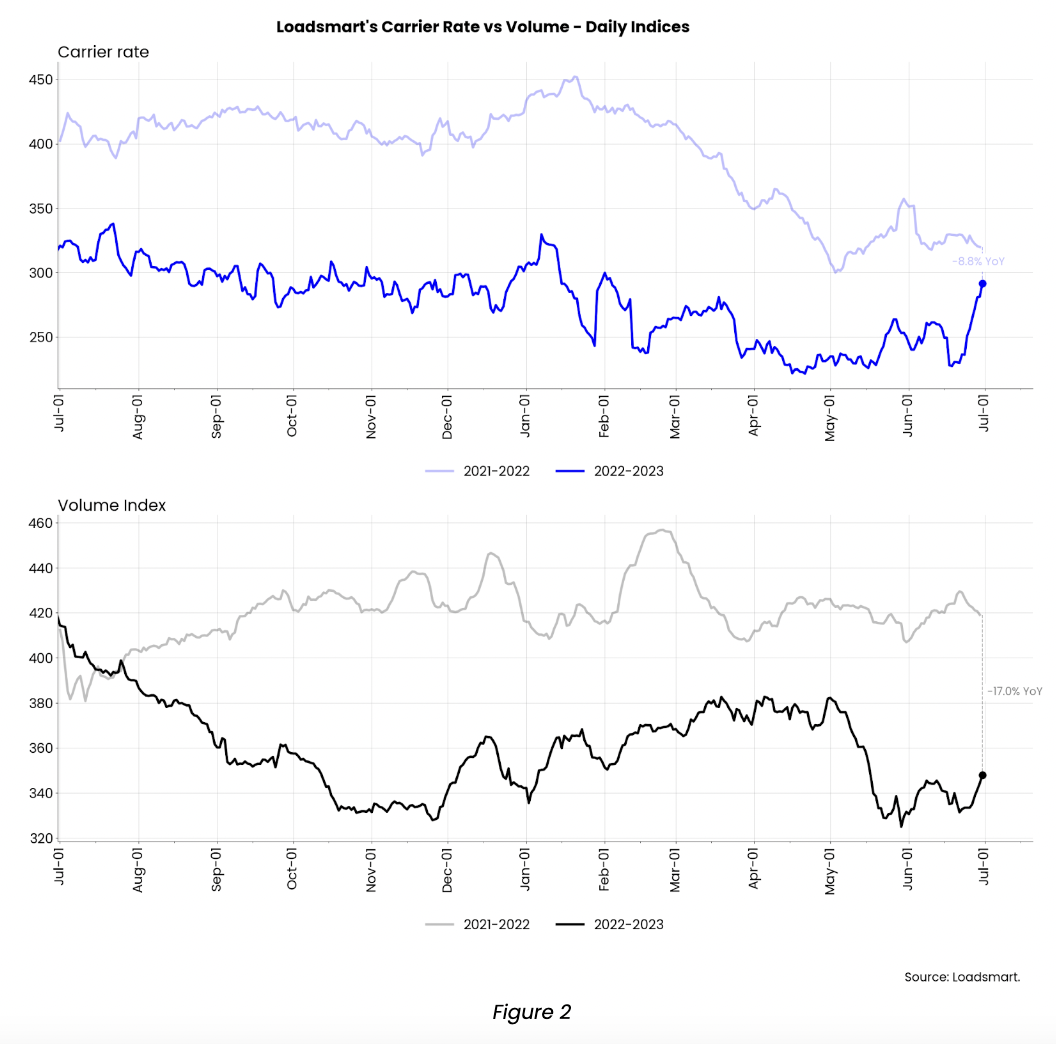
Volumes: Our volumes Index decreased by 4.9% MoM in June. In the first two weeks of June, the index rebounded slightly from its mid-May lows but then it plummeted due to the Juneteenth holiday. After Juneteenth, volumes inched up again.
- In our view, the recent holidays have made our volume data noisy and not very useful for long-term analysis. However, the fact that prices responded so massively to the increase in demand for the 4th of July this year, unlike last year, may indicate that capacity is not as abundant as it once was.
Rates: Our price index increased by 16.5% MoM in June. The index has been on a rather erratic path due to the holidays: prices have had a temporary drop associated with the Juneteenth holiday and a late spike associated with the 4th of July holiday.
- These price fluctuations were greater in the Southwest, West, and Northeast regions, while in other areas they remained stable throughout the month.
- We expect this index to revert back down at least 5-10% as we progress in July, but it should remain above the June lows.

Freight & Economics
Consumers’ recession fears are fading
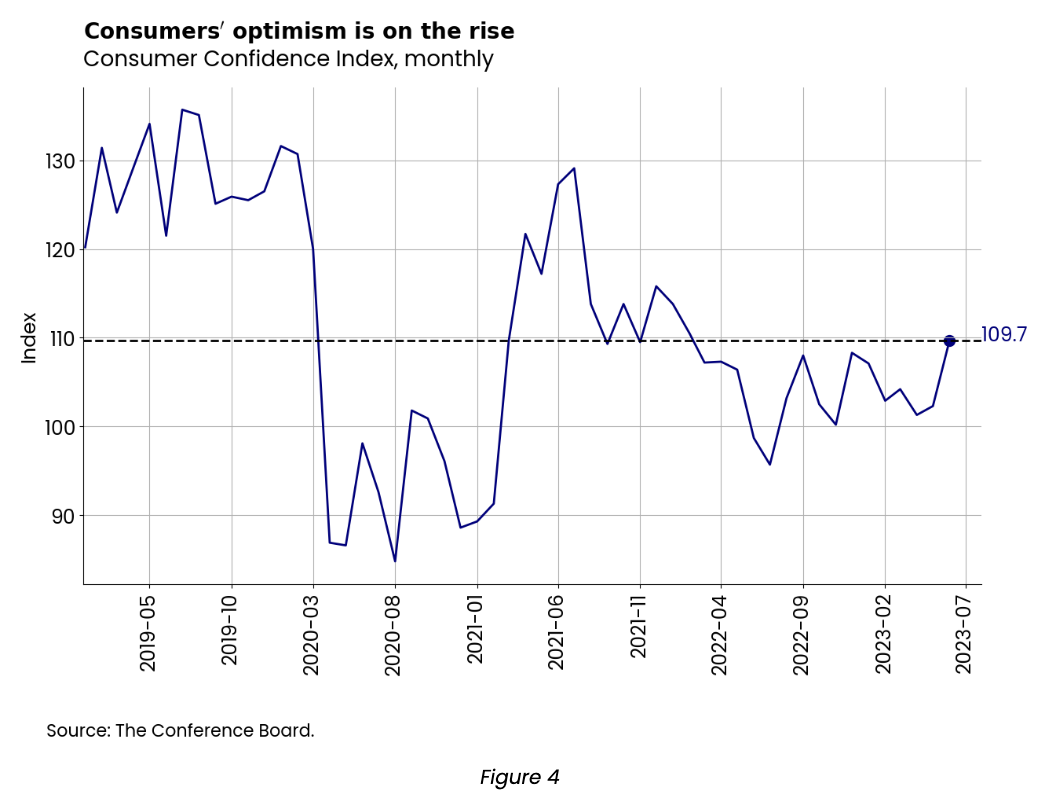
The Conference Board's Consumer Confidence Index rose back to levels seen in early 2022 when consumption was still growing above 5% year-over-year. The index jumped from 102.5 to 109.7 from May to June, as seen in Figure 4.

The rise in the index reflects consumers' optimism about current macroeconomic conditions (the labor market, business conditions, and household income), which might be stemming from recent positive news: inflation is easing, the labor market remains strong and the debt ceiling crisis is over.
Consumption data for the months of May and June are not yet available to indicate whether the improvement in the index has translated into a real increase in spending. However, in the current context of economic uncertainty, the rebound in consumer confidence suggests the odds of a soft landing have been raised, at least from consumers’ perspective.
Factory orders are showing strength, although it is limited to a few sectors
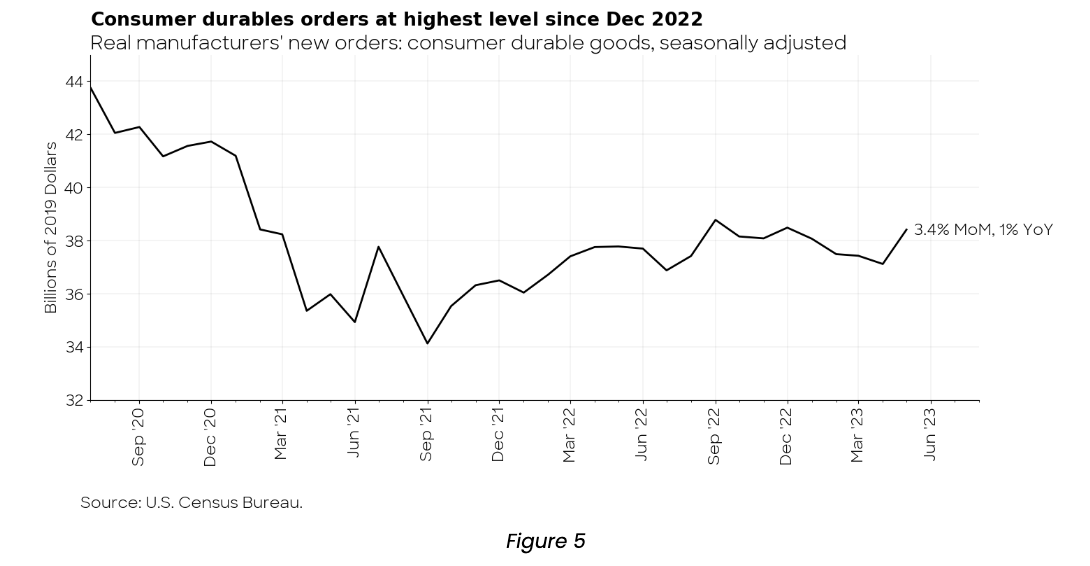
May industrial activity results also show signs of resilience. Real consumer durables orders rose 3.4% MoM - Figure 5.

This strength in the factory orders data is mainly driven by motor vehicles, the only sector that has seen consistent order growth throughout the year. The auto industry is one of the few that is still suffering from the effects of pent-up demand due to production shortages during the pandemic.
Household appliance manufacturing orders grew 4% MoM, after consecutive declines since February, and furniture & related products remained stable.
The Manufacturing ISM Report on Business for June also showed an increase of 7% in the New Orders Index, even though the Production index in the month has declined.
In our view, industrial activity associated with durables will remain stagnant, with outputs below 2020 levels until consumer spending responds to an easing of inflation.
-------------------------------------------------------------------------------------------
Please reach out to Stella Carneiro (stella.carneiro@loadsmart.com) with any questions, suggestions, thoughts, etc. Thank you! We hope you enjoy! #movemorewithless
For more about how you can understand the current market to plan for the future, download our quarterly report.
Share this
- Loadsmart Blog (159)
- Blog (121)
- Shipper (106)
- Market Trends (100)
- Enterprise Shipper (69)
- Carrier (66)
- News (62)
- Data Insights (51)
- Thought Leadership (45)
- Warehouse (41)
- SMB Shipper (38)
- Our Partners (34)
- ShipperGuide TMS (31)
- Opendock (30)
- Product Updates (29)
- Mode Optimization (25)
- Loadsmart (23)
- Mid-Market Shipper (18)
- Case Study (17)
- Brokerage Services (15)
- Managed Transportation (11)
- Video (9)
- Award (7)
- FreightIntel AI (5)
- Instant Execution (4)
- Asset (3)
- Food and Beverage (3)
- Freight Management (3)
- Logistics Solutions (3)
- YMS (3)
- eBook (3)
- 4PL (2)
- International (2)
- NavTrac (2)
- Podcast (2)
- UK (2)
- Yard Management System (2)
- Cold Storage (1)
- Faces of Loadsmart (1)
- Paper Packaging (1)
- Retail (1)
- Security (1)
- Transportation Management System (1)
- December 2025 (1)
- November 2025 (1)
- October 2025 (2)
- September 2025 (1)
- August 2025 (1)
- July 2025 (1)
- June 2025 (1)
- May 2025 (7)
- April 2025 (6)
- March 2025 (3)
- February 2025 (10)
- January 2025 (4)
- December 2024 (4)
- November 2024 (5)
- October 2024 (11)
- September 2024 (11)
- August 2024 (5)
- July 2024 (5)
- June 2024 (9)
- May 2024 (7)
- April 2024 (6)
- March 2024 (2)
- February 2024 (2)
- January 2024 (5)
- December 2023 (6)
- November 2023 (2)
- October 2023 (12)
- September 2023 (5)
- August 2023 (3)
- July 2023 (4)
- June 2023 (10)
- May 2023 (5)
- April 2023 (5)
- March 2023 (7)
- February 2023 (5)
- January 2023 (7)
- December 2022 (4)
- November 2022 (13)
- October 2022 (4)
- September 2022 (7)
- August 2022 (11)
- July 2022 (6)
- June 2022 (5)
- May 2022 (2)
- April 2022 (4)
- March 2022 (6)
- February 2022 (7)
- January 2022 (9)
- December 2021 (3)
- November 2021 (5)
- October 2021 (7)
- September 2021 (2)
- August 2021 (2)
- July 2021 (4)
- June 2021 (6)
- May 2021 (6)
- April 2021 (5)
- March 2021 (8)
- February 2021 (3)
- January 2021 (3)
- December 2020 (7)
- November 2020 (9)
- October 2020 (7)
- September 2020 (6)
- August 2020 (10)
- July 2020 (8)
- June 2020 (3)
- May 2020 (1)
- April 2020 (2)
- March 2020 (2)
- February 2020 (1)
- January 2020 (1)
- November 2019 (2)
- October 2019 (1)
- September 2019 (2)
- August 2019 (3)
- July 2019 (2)
- June 2019 (2)
- May 2019 (3)
- March 2019 (1)
- February 2019 (3)
- December 2018 (1)
- November 2018 (2)
- October 2018 (1)
- September 2018 (2)
- August 2018 (1)
- July 2018 (1)
- June 2018 (3)
- May 2018 (4)
- April 2018 (1)
- February 2018 (1)
- January 2018 (4)
- November 2017 (1)
- October 2017 (2)
- June 2017 (1)
- May 2017 (2)
- April 2017 (1)
- February 2017 (1)
- January 2017 (2)
- October 2016 (1)
- August 2016 (1)
- July 2016 (2)
- June 2016 (1)
- March 2016 (1)
- January 2016 (1)
- December 2015 (3)
- November 2015 (2)
- October 2015 (6)
- July 2015 (1)
- June 2015 (1)
- April 2015 (2)
- March 2015 (13)
- February 2015 (17)
- January 2015 (15)
- December 2014 (35)
- November 2014 (26)
- October 2014 (60)
- September 2014 (2)
