Share this
by jpallmerine
As usual, in this Monthly Market Update, we will provide a brief update & analysis of the full truckload market and present some compelling trucking-related economic analysis to provide a macroeconomic view on the state of the market. Please reach out to Stella Carneiro (stella.carneiro@loadsmart.com) with any questions, suggestions, thoughts, etc. Thank you! We hope you enjoy! #movemorewithless

Our model predicts that spot rates will rise from $2.57 in October to $2.65 in November (3% growth).
Our 3-month smoothed rate increased in October because of the positive performance of the average monthly rate in August and September. October's average monthly rate (not smoothed) actually declined slightly - see the gray line in Figure 1.
Given the better-than-expected performance of our rates in August and September, our model suggests that there is not much room for a significant recovery in the coming months. Our smoothed rate should end the year at $2.67.- For next year, the EIA's December 2024 diesel price forecast was revised by 8%, so our rate forecast for that date increased in response - from $3.41 to $3.52.
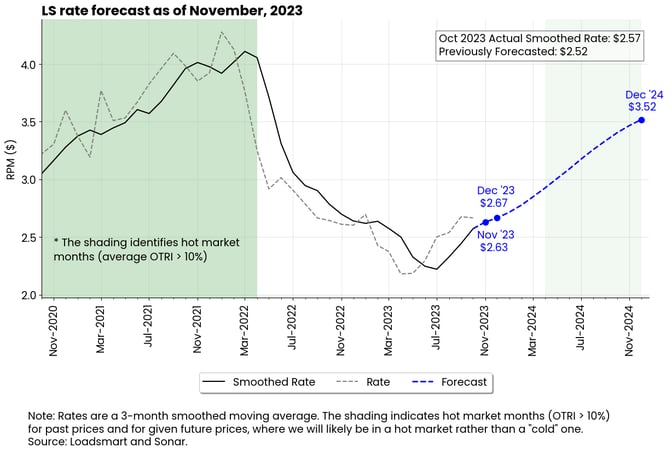
Figure 1
October's Full Truckload Market Review:
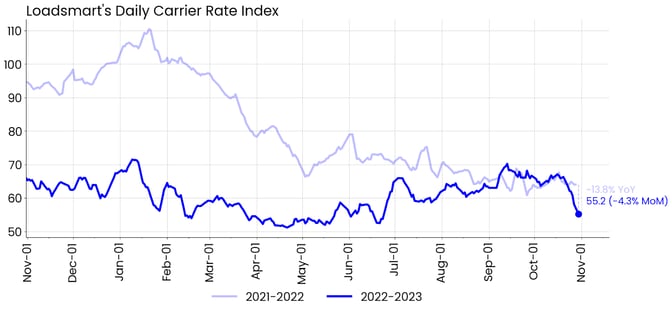
Figure 2
Rates: Our Price Index decreased by 4.3% MoM in October. Rates held steady through the middle of the month but then dropped sharply. The decline occurred in all regions of the country except the Northeast, where rates maintained the upward trend that began in April.- Our data was consistent with the performance of the Sonar OTRI. Despite the instability of the index during the month, the OTRI also began a downward trend in mid-October.
- We do not expect rates to stay this low in November. We believe that both the rate and OTRI dips are temporary.
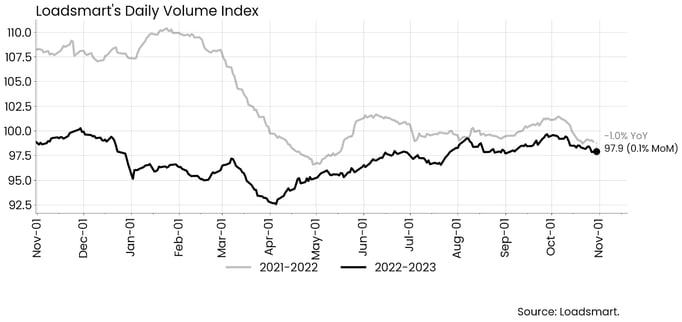 Figure 3
- The performance of our index is in line with the OTVI, which was essentially unchanged over the month.
Freight & Economics
Holiday season pricing
There are a few national holidays that can temporarily increase prices, namely the Fourth of July, Black Friday, and Christmas/New Year's, as we can see in Figure 4. Historically, rate increases due to these events have been most pronounced in up-cycle markets when capacity is tight.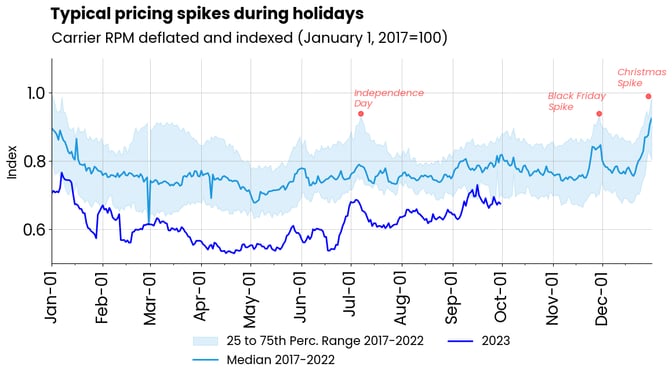
Figure 4
Last year, there were no temporary price spikes associated with the holidays, as capacity was loose and prices fell steadily throughout 2H2022. However, this year's rebound in prices in April/May and the Fourth of July price spike suggest that there may be more temporary spikes over the year-end holidays.On the demand side, the NFR data signals that there will be no real gains in retail sales over the last year, as their 3-4% growth forecast equates to zero real growth when adjusted for inflation. But on the supply side, there are over 15,000 fewer carriers in the market compared to last year.
The current state of the LTL business
Despite the recessionary environment that continues to stifle the freight market in 2023, this has been a year of consolidation for Loadsmart in the LTL market. Underlying economic conditions, combined with our internal efforts to grow our presence in this mode's market, have driven the LTL freight volumes quoted on our platform to double since 2022 (Figure 5).
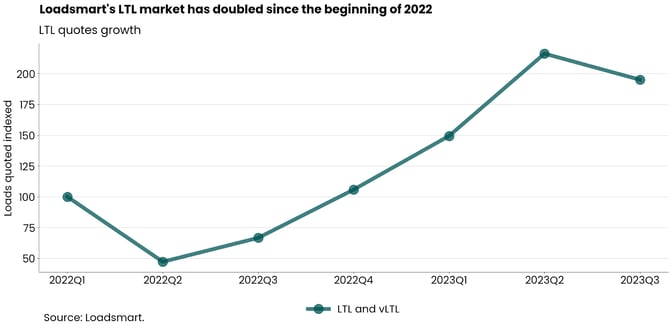
Figure 5
In our view, this is a market that will continue to grow over the next few years, not only as a result of the redistribution of Yellow's market share within the industry but also as a result of broader factors.
In the short term, increased demand for LTL will likely be driven by retailers seeking more cost-effective shipping options, even if it means waiting longer for inventory to arrive.
- With the risk of recession and the associated slowdown in consumption lingering throughout the year, retailers are in constant fear of overstocking.
- In this context, the size of the orders is being reduced to the minimum possible to keep inventory levels low, leading many companies to opt for LTL.
- According to August data from the Department of Commerce, retailers' inventory-to-sales ratio is 1.3, down from an average of 1.43 over the 2010-2020 decade, before supply chains were disrupted by the pandemic.
Additionally, there is one fundamental factor benefiting LTL over the long run: the growth of e-commerce, its primary customer. Online shopping should continue to grow as a proportion of core retail sales (as shown in Figure 6). This will not only increase the demand for LTL shipping but may reduce its operating costs through economies of scale in the long run - which has yet to happen.
- Sonar's data shows that the LTL rate per 100 pounds has increased from $13.9 to $36.9 from Jan 2017 to Jan 2023, an increase of over 150%.
- However, we expect that wider market adoption of dynamic pricing can improve this business density and help carriers reduce costs without sacrificing their revenues.
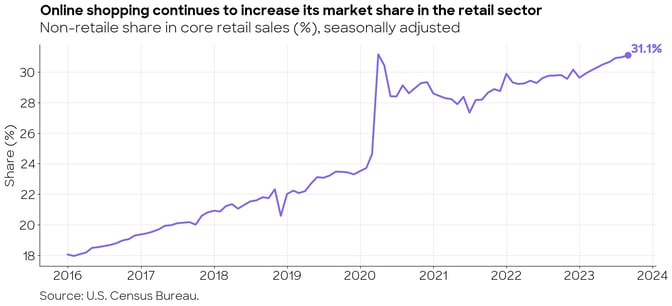
Figure 6