Share this
Loadsmart’s Q1 2019 State of Truckload
by admin
Loadsmart’s “State of Truckload” report combines Loadsmart’s proprietary rate and capacity data with third party information to help explain what happened in the market during the previous quarter.
Here’s what we’ve observed.
Contents:
Summary
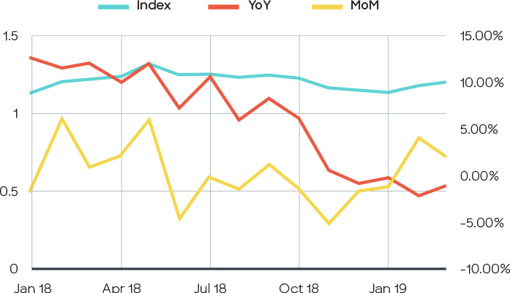
The first quarter of 2019 saw increasing concern about the possibility of an economic slowdown and how it might impact transportation markets. Cass Information’s Freight Shipment Index, an index based on $28b in freight volume, has remained negative on a year-over-year basis since December 2018, meaning monthly freight volumes have been consistently lower than 2018 levels.
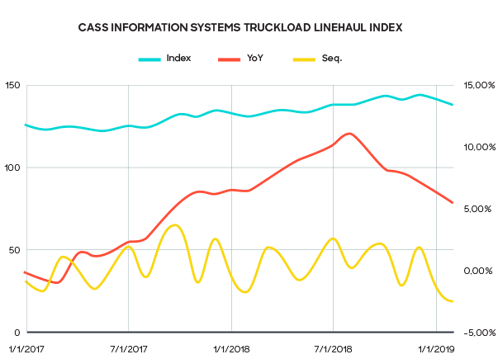
Further, while truckload linehaul rates continued to improve month over month since January, their rate of growth has been in decline since December. This is not altogether unexpected, as January and February are typically slow months for truckload freight.
CASS INFO FREIGHT SHIPMENT INDEX
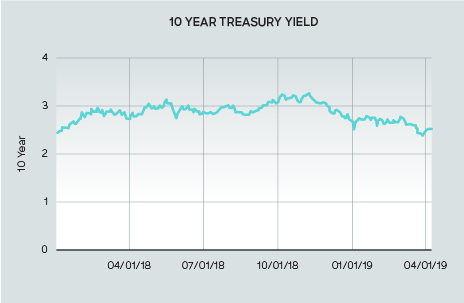
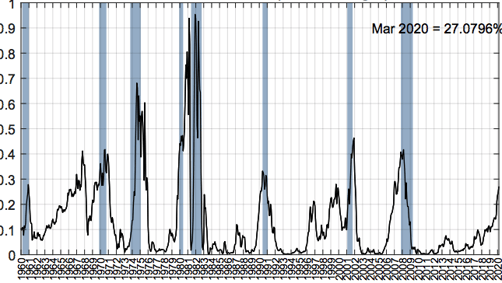
The US economy offered its own set of mixed signals. After the 10-year Treasury Yield moved into correction territory in December of 2018 (2.52% in December) and initially recovered in February (2.73% on 2/4/19), it fell back again into correction levels at the end of March (2.41% on 3/31/2019). Adding more fuel to the fire, the New York Federal Reserve estimated that the probability of a 2020 recession had risen to 27.07% in April, its highest level since 2008-2009.
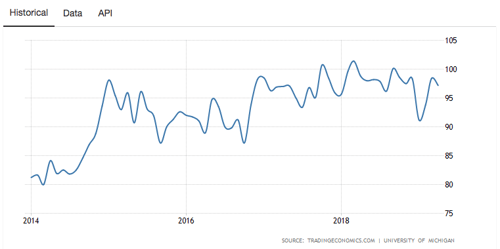
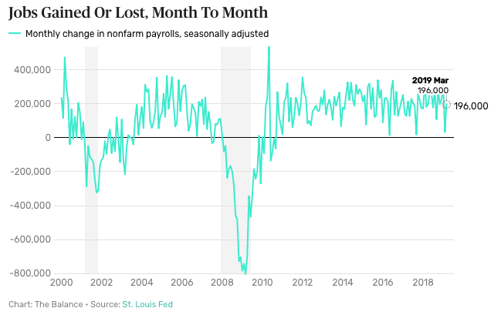
Meanwhile consumer sentiment, after showing signs of decline in February, grew to 98.4 in March, its highest level since October 2018. The jobs report, after giving an initial scare in February, posted 196,000 new jobs in March, in hovering near its 102-month average.
CONSUMER SENTIMENT INDEX
It’s important to note — these trends have not happened in a vacuum. The month-long government shutdown, combined with tariffs and the threat of a trade war with China have taken their toll on the markets and added an extra headwind for Q1.
The net-net? Q1 indicators showed a slowdown compared to last year, but it’s not time to turn completely negative in our outlook. 2019 will show continued growth, albeit slower than the breakout levels of 2018.
In an abundance of caution, we’d advise paying closer attention to freight volumes and other economic indicators as we move into Q2 2019.
GLASS HALF FULL:
While we won’t see the meteoric volume and rates of 2018, we’ll see steady, more measured, growth in 2019.
- Freight volume, while lower than the blockbuster levels of 2018, has shown month over month growth since January
- Consumer Sentiment for March reached 98.4, -3.3% over the same time last year, but +4.4% over February 2019
- Non-farm payrolls grew by 196,000 jobs in March 2019, exceeding the 170,000 target and eliminating fears generated from the 33,000 jobs in February’s report
- Construction spending for January and February remains above 2018 levels (+1%)
- The impact of the government shutdown is temporary, with the economy expected to further stabilize in Q2
GLASS HALF EMPTY:
Economic contraction is on the horizon, we just don’t know when.
- Freight volume has been down on a YoY basis for four consecutive months
- YoY growth for truckload linehaul rates has been slowing since mid-2018
- 10-year treasury yield has fallen back into correction territory (2.41% on 3/31/2019)
- Probability of a recession in 2020 has risen to its highest level since 2008-2009
Capacity
TRUCKLOAD CAPACITY SURGES IN Q1 2019
Outside of reduced shipment volume, rates in the first quarter remained low in large part due to excess capacity. Available trucks were able to cover most surges in demand, resulting in rates staying relatively flat or declining.
There are a couple of interesting takeaways here. First, a strong 2018 freight market coupled with savings from the 2018 federal tax cut led fleets to order more trucks than needed to replace older trucks — those new trucks are hitting the road now . Second, the initial capacity shortage tied to ELD implementation last April has passed, with previously sidelined equipment now making it back onto the road.
Quite simply, we haven’t seen this much capacity in years.
DRY VAN
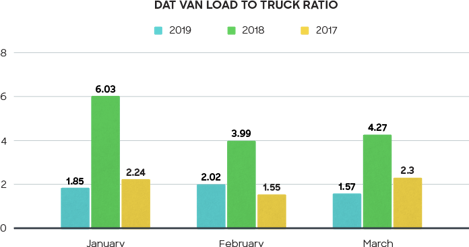
DAT’s Van Load to Truck ratio hovered between 1.5 and 2.0 loads per truck from January to March, a sharp difference from just a year ago when the ratio was between 4 and 6 loads per truck. For two out of the three months, the 2019 ratio even remained below 2017 levels.
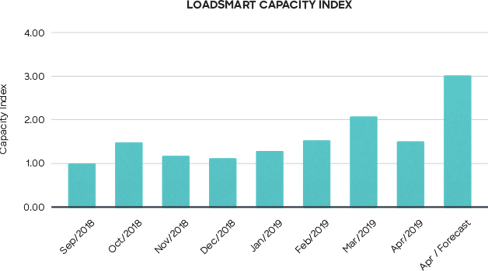
According to Loadsmart’s own proprietary capacity index, which is essentially an aggregated view of available trucks from dozens of sources, capacity has only continued to strengthen in Q1. March available truck postings grew 36% over February and April is already on pace to exceed March.
REEFER
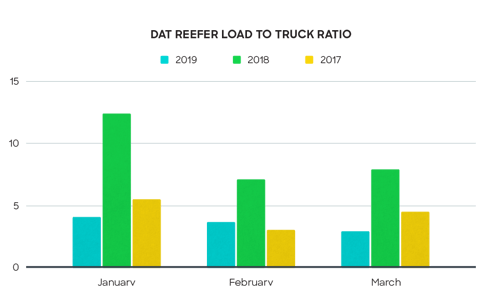
In the first quarter, excess capacity was not limited to just van. The DAT reported that reefer load to truck ratios remained below 2018 and 2017 levels, hovering between 3.0 – 4.0 loads per truck between January and March. That’s nearly a 50% increase in capacity compared to 2018, when the load to truck ratio was between 7.0 and 12.
And while everyone expected the market to be soft in Q1, the ‘spring produce surge’ that typically starts to drive higher freight volumes had not yet arrived by March, delayed by flooding in the midwest and continued bad weather. It will be an important signal to watch as we move into Q2.
Rates
EXCESS CAPACITY AND REDUCED SHIPMENT VOLUME CREATE A PERFECT STORM FOR LINEHAUL RATES
According to Cass Information Systems, truckload linehaul rates (without fuel) continued to contract throughout Q1, while remaining 6% above the previous years levels. This should come as no surprise, as demand remains soft and capacity has begun to rebound from the near crisis levels experienced during 2018.

DRY VAN
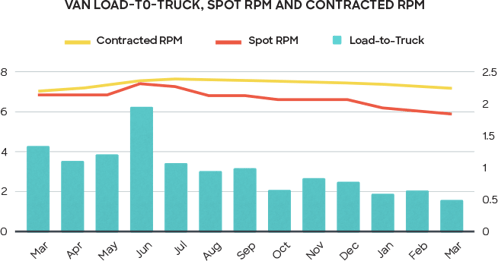
Van spot rates (including fuel), have been in steady decline since reaching $2.83 per mile in June of 2018 according to the DAT. In the first quarter of 2019, spot rates fell 5.1%, sliding from $1.95 / mile to an average of $1.85. And while rising diesel prices helped spot rates reach their peak in 2018, they have had a decidedly neutral impact in the first quarter.
Contracted rates remained relatively stable through December of 2018, but decreased roughly 2.5% in Q1, moving from $2.32 in January to $2.26 in March.
REEFER
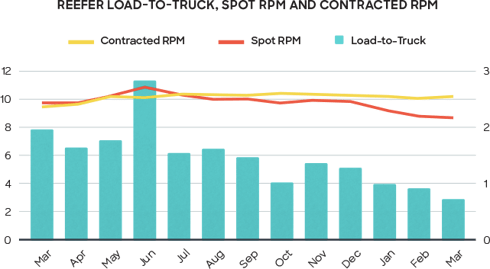
Reefer rates followed a similar trend to dry van. Spot prices declined 6% in Q1, moving from $2.31 per mile to an average of $2.17. Contracted rates held their own, staying relatively stable at $2.54 per mile.
Fuel
DIESEL PRICES RELATIVELY CONSISTENT IN FIRST QUARTER, REMAIN BELOW 2018 PEAK
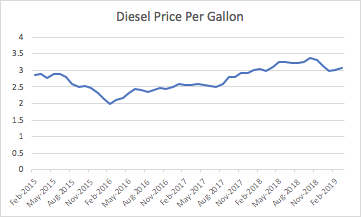
While the price of diesel had a decidedly positive bias on overall freight expenditures in
2018, it was relatively neutral in the first quarter of 2019, with prices staying flat in January and February, while increasing 2.5% in March ($3.076 / gallon). The United States Energy Information Administration has forecasted the cost of diesel at $3.08 per gallon in 2019, so we’ll likely see rates creep up as we make our way through the rest of the year.
Wrapping Up
With year over year freight volume declining for the fourth consecutive month, in addition to other economic indicators like the falling 10-year Treasury Yield, there’s now good reason for elevated concern. However, that concern should be weighted by the fact that month over month volume is growing, and demand still outstrips available capacity.
Our take? While elevated concern around economic contraction in 2020 is appropriate, it’s not yet time for doom and gloom. Shippers have an opportunity to save in 2019 while capacity is high and spot rates are in decline.
How Loadsmart Can Help
Loadsmart can help you take advantage of favorable market conditions by inserting real time rates alongside the static prices in your routing guide. This is made possible via direct integration with your TMS. In today’s market, there’s nearly a 20% gap between spot and contracted rates — savings which can be captured with Dynamic Routing.
Ready to Learn More?
Contact us at sales@loadsmart.com or (646) 887 6278. We look forward to working with you.
Materials in this presentation may contain information about Loadsmart Inc.’s future plans and prospects that constitute forward-looking statements for purposes of the safe harbor provisions under the Private Securities Litigation Reform Act of 1995. Included in forward looking statements are statements such as:
- Statements regarding market trends in the U.S. freight industry, including freight volume and pricing, market size and the state of transportation management systems;
Some forward-looking statements can also be identified by terminology such as “may,” “will,” “could,” “should,” “anticipate,” “believe,” “contemplate,” “estimate,” “expect,” “intend,” “plan,” “predict,” “project,” or similar words.
Such forward-looking statements are based on our current expectations and involve inherent risks and uncertainties, including factors that could delay, divert or change such statements, and could cause actual outcomes and results to differ materially from our current expectations. No forward-looking statement can be guaranteed. In evaluating forward-looking statements or forward-looking information, we caution readers not to place undue reliance on any forward-looking statement, and readers should specifically consider the various factors which could cause actual events or results to differ materially from those indicated by such forward-looking statements.
In addition, any information contained in this presentation was current as of the date presented and should not be relied upon as representing our estimates as of any subsequent date. While we may elect to update forward-looking statements at some point in the future, we specifically disclaim any obligation to do so, even if our estimates change, whether as a result of new information, future events or otherwise. Consequently, readers should not rely upon the information as current or accurate after the presentation date.
Share this
- Loadsmart Blog (159)
- Blog (121)
- Shipper (106)
- Market Trends (101)
- Enterprise Shipper (69)
- Carrier (66)
- News (62)
- Data Insights (51)
- Thought Leadership (45)
- Warehouse (41)
- SMB Shipper (38)
- Our Partners (34)
- ShipperGuide TMS (31)
- Opendock (30)
- Product Updates (29)
- Mode Optimization (25)
- Loadsmart (23)
- Mid-Market Shipper (18)
- Case Study (17)
- Brokerage Services (15)
- Managed Transportation (11)
- Video (9)
- Award (7)
- FreightIntel AI (5)
- Instant Execution (4)
- Asset (3)
- Food and Beverage (3)
- Freight Management (3)
- Logistics Solutions (3)
- YMS (3)
- eBook (3)
- 4PL (2)
- International (2)
- NavTrac (2)
- Podcast (2)
- UK (2)
- Yard Management System (2)
- Cold Storage (1)
- Faces of Loadsmart (1)
- Paper Packaging (1)
- Retail (1)
- Security (1)
- Transportation Management System (1)
- January 2026 (1)
- December 2025 (1)
- November 2025 (1)
- October 2025 (2)
- September 2025 (1)
- August 2025 (1)
- July 2025 (1)
- June 2025 (1)
- May 2025 (7)
- April 2025 (6)
- March 2025 (3)
- February 2025 (10)
- January 2025 (4)
- December 2024 (4)
- November 2024 (5)
- October 2024 (11)
- September 2024 (11)
- August 2024 (5)
- July 2024 (5)
- June 2024 (9)
- May 2024 (7)
- April 2024 (6)
- March 2024 (2)
- February 2024 (2)
- January 2024 (5)
- December 2023 (6)
- November 2023 (2)
- October 2023 (12)
- September 2023 (5)
- August 2023 (3)
- July 2023 (4)
- June 2023 (10)
- May 2023 (5)
- April 2023 (5)
- March 2023 (7)
- February 2023 (5)
- January 2023 (7)
- December 2022 (4)
- November 2022 (13)
- October 2022 (4)
- September 2022 (7)
- August 2022 (11)
- July 2022 (6)
- June 2022 (5)
- May 2022 (2)
- April 2022 (4)
- March 2022 (6)
- February 2022 (7)
- January 2022 (9)
- December 2021 (3)
- November 2021 (5)
- October 2021 (7)
- September 2021 (2)
- August 2021 (2)
- July 2021 (4)
- June 2021 (6)
- May 2021 (6)
- April 2021 (5)
- March 2021 (8)
- February 2021 (3)
- January 2021 (3)
- December 2020 (7)
- November 2020 (9)
- October 2020 (7)
- September 2020 (6)
- August 2020 (10)
- July 2020 (8)
- June 2020 (3)
- May 2020 (1)
- April 2020 (2)
- March 2020 (2)
- February 2020 (1)
- January 2020 (1)
- November 2019 (2)
- October 2019 (1)
- September 2019 (2)
- August 2019 (3)
- July 2019 (2)
- June 2019 (2)
- May 2019 (3)
- March 2019 (1)
- February 2019 (3)
- December 2018 (1)
- November 2018 (2)
- October 2018 (1)
- September 2018 (2)
- August 2018 (1)
- July 2018 (1)
- June 2018 (3)
- May 2018 (4)
- April 2018 (1)
- February 2018 (1)
- January 2018 (4)
- November 2017 (1)
- October 2017 (2)
- June 2017 (1)
- May 2017 (2)
- April 2017 (1)
- February 2017 (1)
- January 2017 (2)
- October 2016 (1)
- August 2016 (1)
- July 2016 (2)
- June 2016 (1)
- March 2016 (1)
- January 2016 (1)
- December 2015 (3)
- November 2015 (2)
- October 2015 (6)
- July 2015 (1)
- June 2015 (1)
- April 2015 (2)
- March 2015 (13)
- February 2015 (17)
- January 2015 (15)
- December 2014 (35)
- November 2014 (26)
- October 2014 (60)
- September 2014 (2)