Share this
by aaronroseman
Loadsmart’s “State of Truckload” report combines Loadsmart’s proprietary rate and capacity data with third party information to help explain what happened in the market during the previous quarter.
Here’s what we’ve observed.
Contents:
-
- Disclaimer: Forward-Looking Statements
- Report Summary
- Rates: Truckload Linehaul Rates Increase Month over Month Due to Seasonality While Remaining Lower than 2018 Levels
- Capacity: Truckload Capacity Surplus Continues in Q3
- Fuel: Diesel Prices Decrease in July and August Before Moderately Increasing in September
Summary
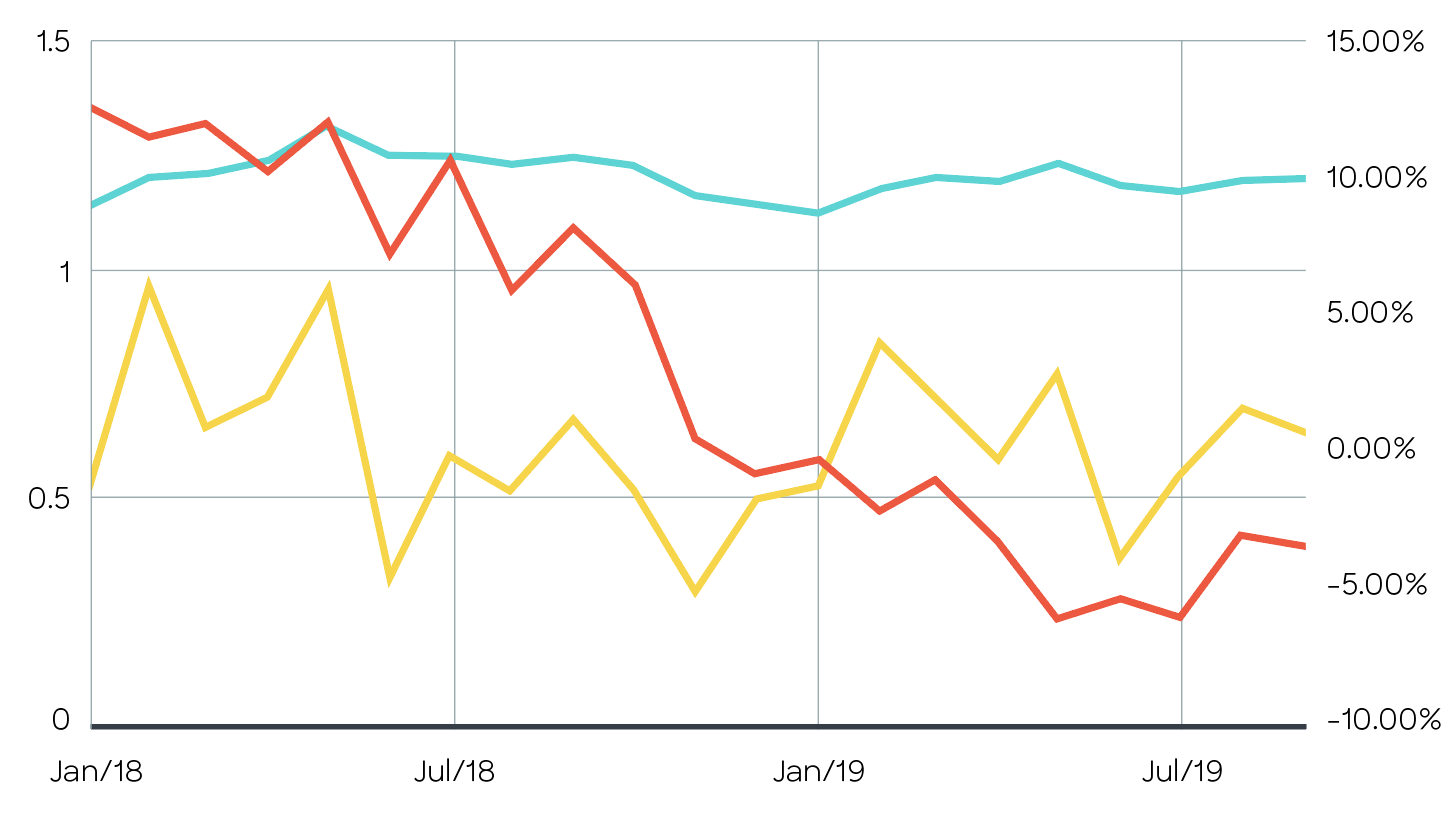
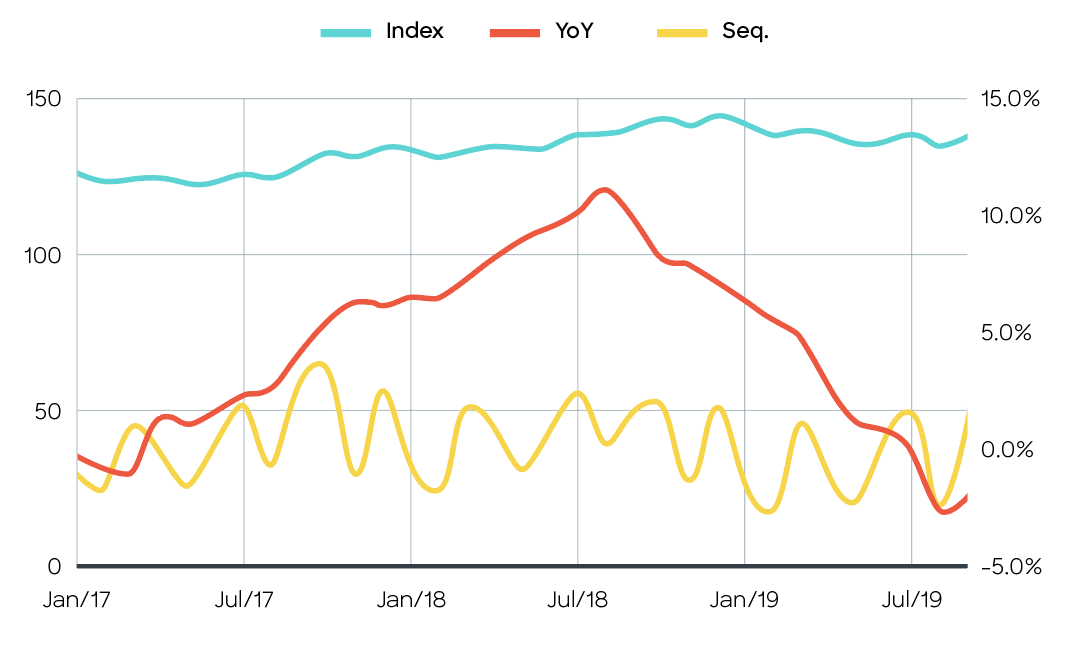
The third quarter of 2019 saw signals shift from warning about the possibility of a slow down to indicating an economic contraction. Cass Information’s Freight Shipment Index, an index based on $28b in freight volume, has remained negative on a year-over-year basis since December 2018, meaning monthly freight volumes have been consistently lower than 2018 levels for ten consecutive months. In Q3 the index was down an average of -4.11% per month compared to the same time the previous year.
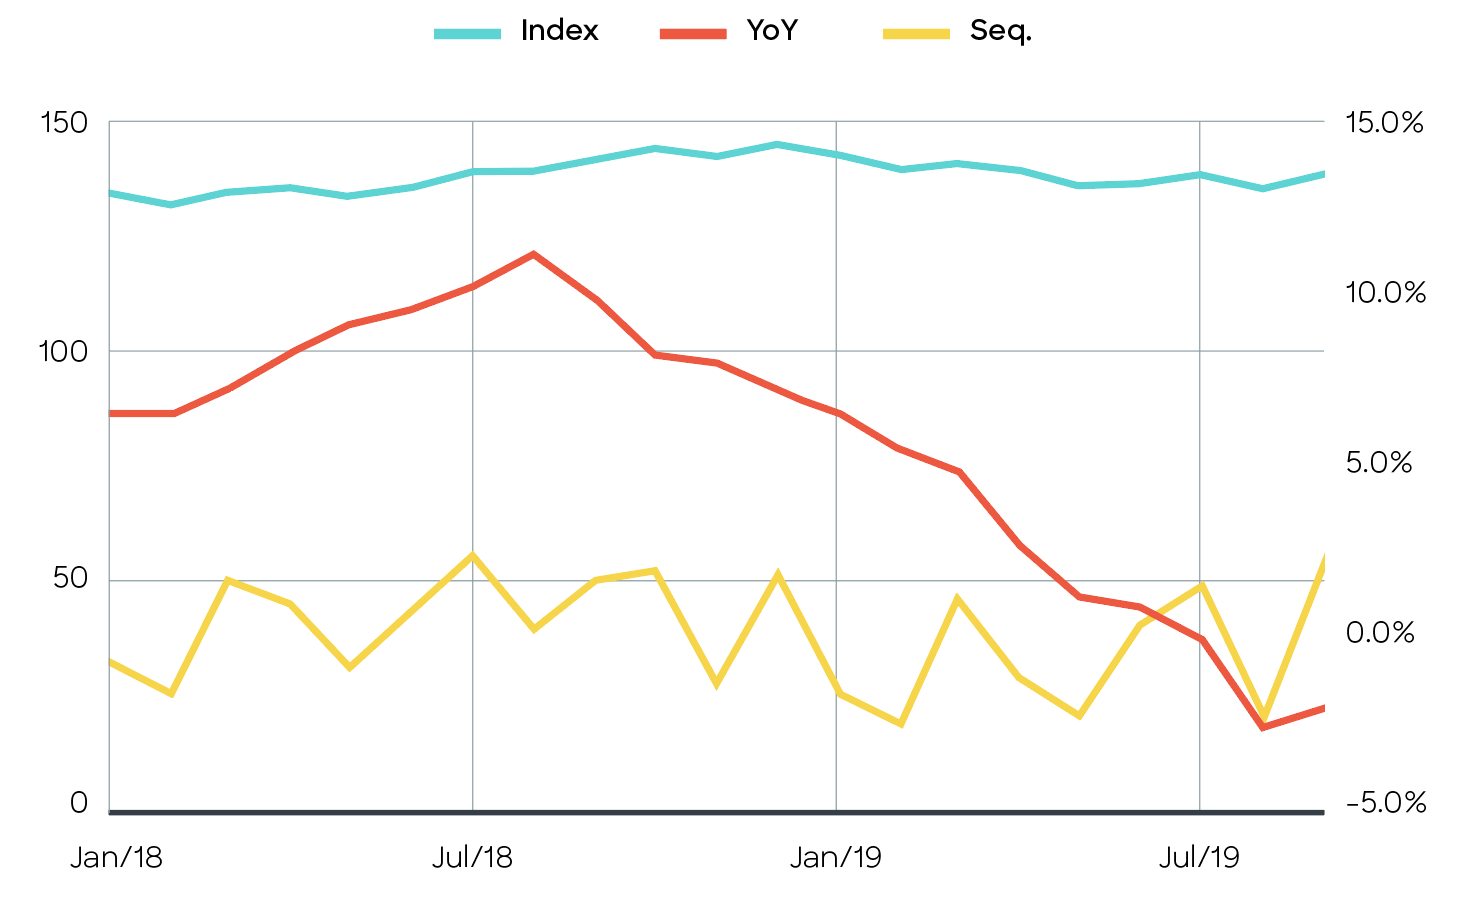
And while linehaul rates showed signs of improvement in the third quarter, with modest month over month growth in July (+1.5%) and September (+2.3%), they remained on average -1.53% below the same time last year.
CASS INFO FREIGHT SHIPMENT INDEX
CASS INFO LINEHAUL RATE INDEX
The US economy also offered its own indicators suggesting signs of an economic contraction. The 10-year Treasury Yield continued to fall in July and August before initially improving in September, reaching a peak of 1.901 on 9/14. Unfortunately, that improvement quickly evaporated as it fell to 1.675 by 9/30, which put it inline with levels previously seen in mid-August. As of mid-October, it has recovered to 1.755.
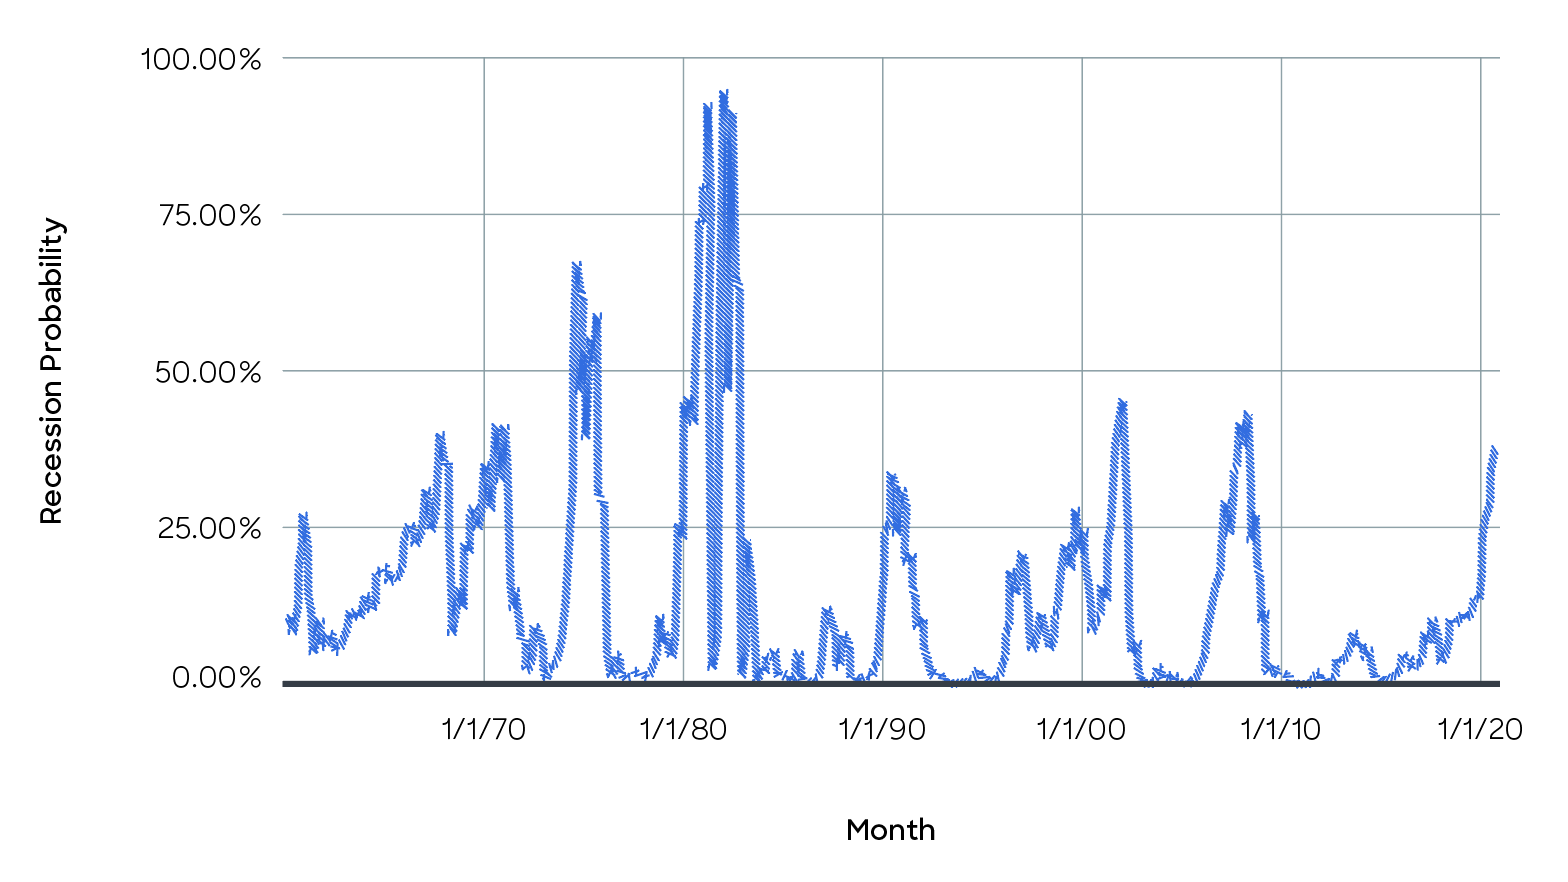
Adding more fuel to the fire, the New York Federal Reserve estimated that the probability of a 2020 recession had risen to 37.93% in August, its highest level since March 2008, before slightly decreasing to 34.8% in September. Meanwhile consumer sentiment has been in decline since March (94), hitting 89 in September — a -5.3% decrease. The jobs report came in with preliminary numbers for September at 180,000 – a healthy uptick from the original projection of 136,000. It will be an important metric to watch as the number is finalized in the coming months.
RECESSION PROBABILITY BY MONTH
CONSUMER SENTIMENT BY MONTH
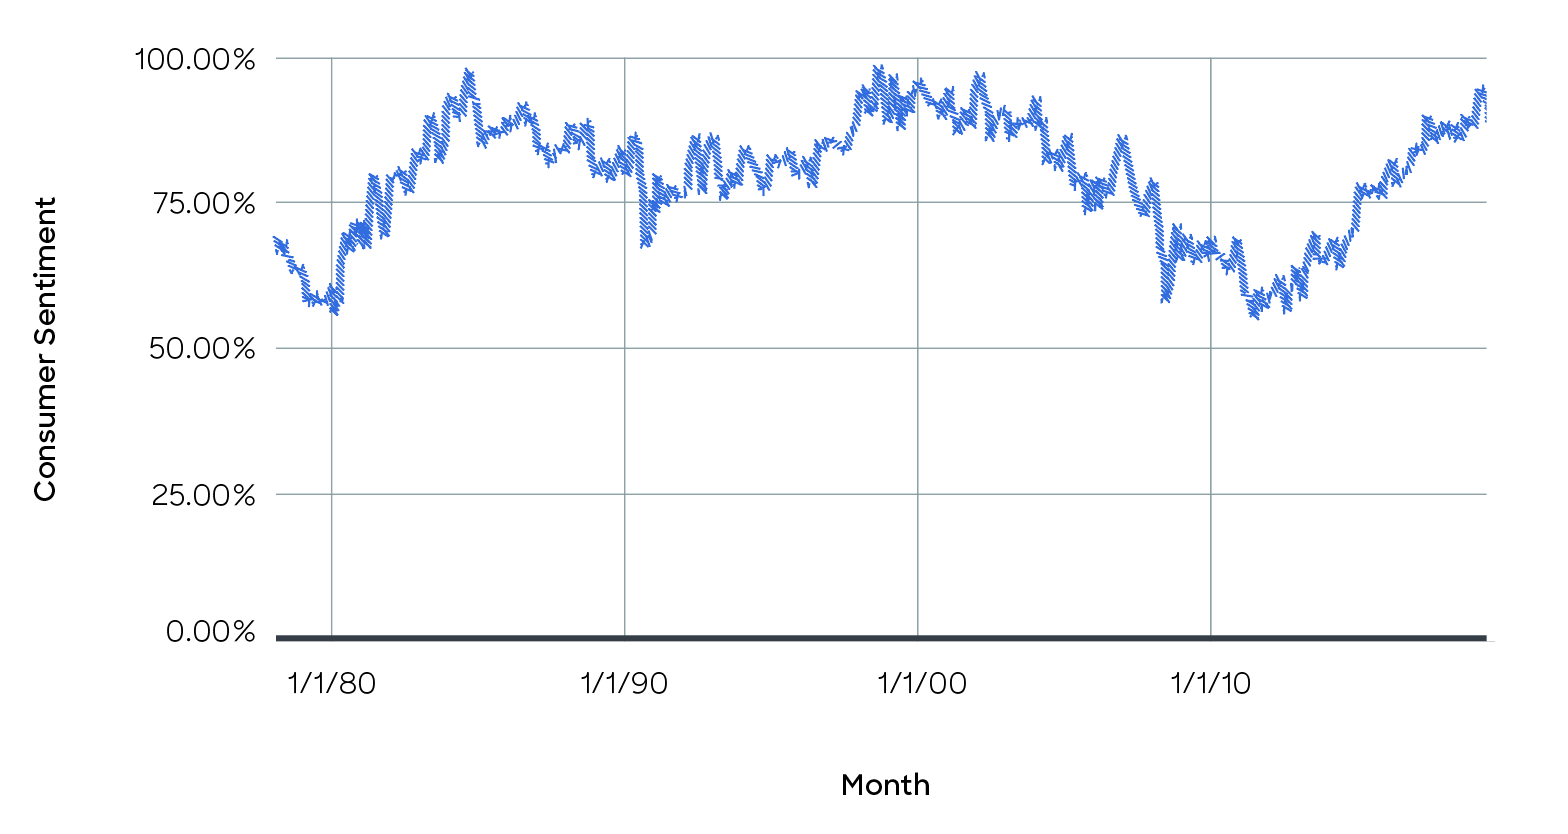
It’s important to note — “soft” economic data like consumer sentiment have finally begun to show cracks as the trade war with China continues. This was particularly evident in August as consumer sentiment fell by the most since 2012, coinciding with the U.S. declaring China a currency manipulator and both sides issuing new rounds of tariffs on one another’s imports.
The net-net? Q3 indicators are showing early signs of an economic contraction.
GLASS HALF FULL:
-
Linehaul rates showed MoM improvement in July & September
-
Cass Information Systems Shipment Index showed moderate MoM growth in August and September
- Non-farm payrolls group by 180,000 in September, according to the preliminary jobs report
GLASS HALF EMPTY:
- Freight volume has been down on a YoY basis for ten consecutive months
-
Consumer sentiment has finally begun to show signs of weakness. In August it fell by the most since 2012
-
Probability of a recession in 2020 hit its highest level since 2008-2009 in August (37.93%), before decreasing slightly to 34.8%
-
10-year treasury yield shows continued signs of decline, reaching 1.675 at the end of September, before recovering slightly by mid-October
Capacity
TRUCKLOAD CAPACITY SURPLUS CONTINUES IN Q3 2019
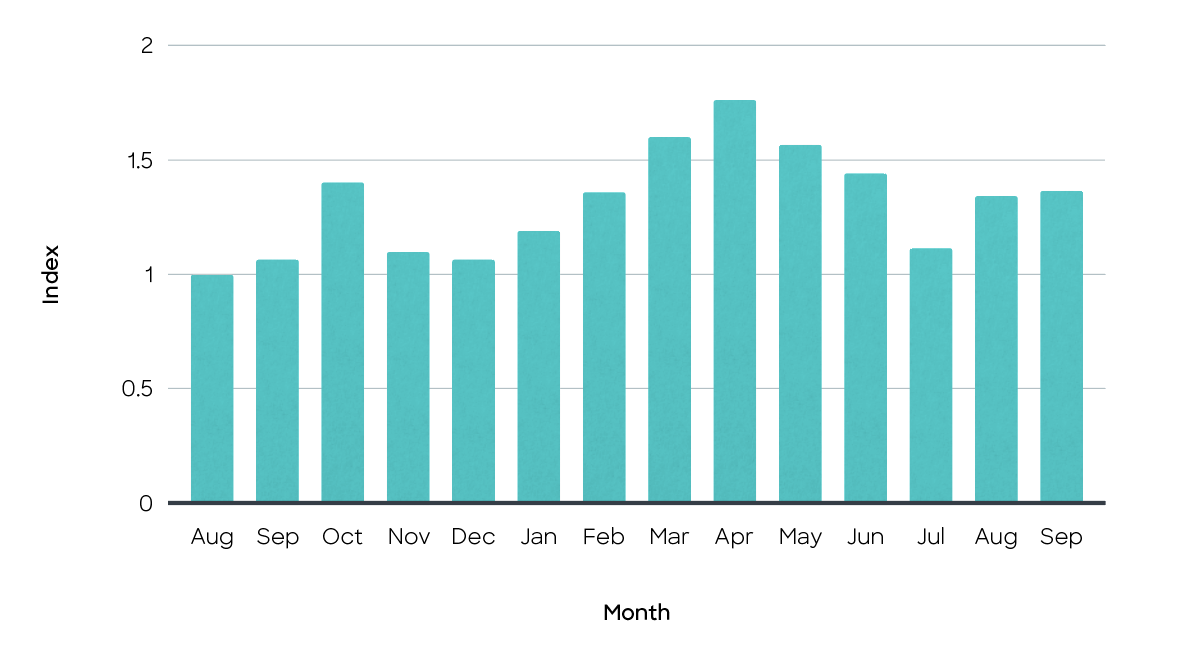
In the third quarter truckload capacity across both dry van and reefer remained above levels previously seen in 2018 and 2017. This is not altogether unexpected, as 2018 was a breakout year for shipment volume and capacity was constrained due to new regulations and other factors. According to Loadsmart’s own proprietary capacity index, which is an aggregated view of available truck data from several sources, capacity tightened roughly 22% in July before returning to levels 5-7% lower what was previously seen in June. This is still notably tighter from the peak available truck numbers posted in April.
LOADSMART CAPACITY INDEX
DRY VAN
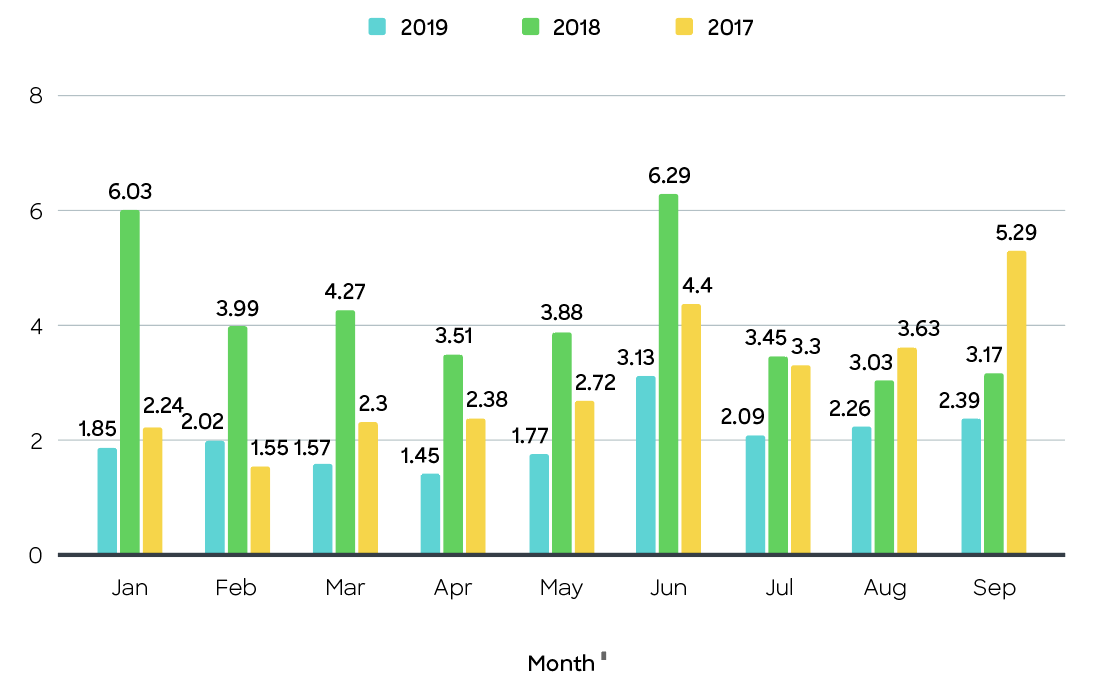
After showing an initial contraction in June, DAT’s Van Load to Truck Ratio hovered between 2.09 and 2.39 loads per truck from July to September. On average, this represented a 6% increase over ratios seen in the second quarter, while still remaining 25-50% lower than what was previously recorded 2018 and 2017.
DAT VAN LOAD TO TRUCK RATIO
REEFER
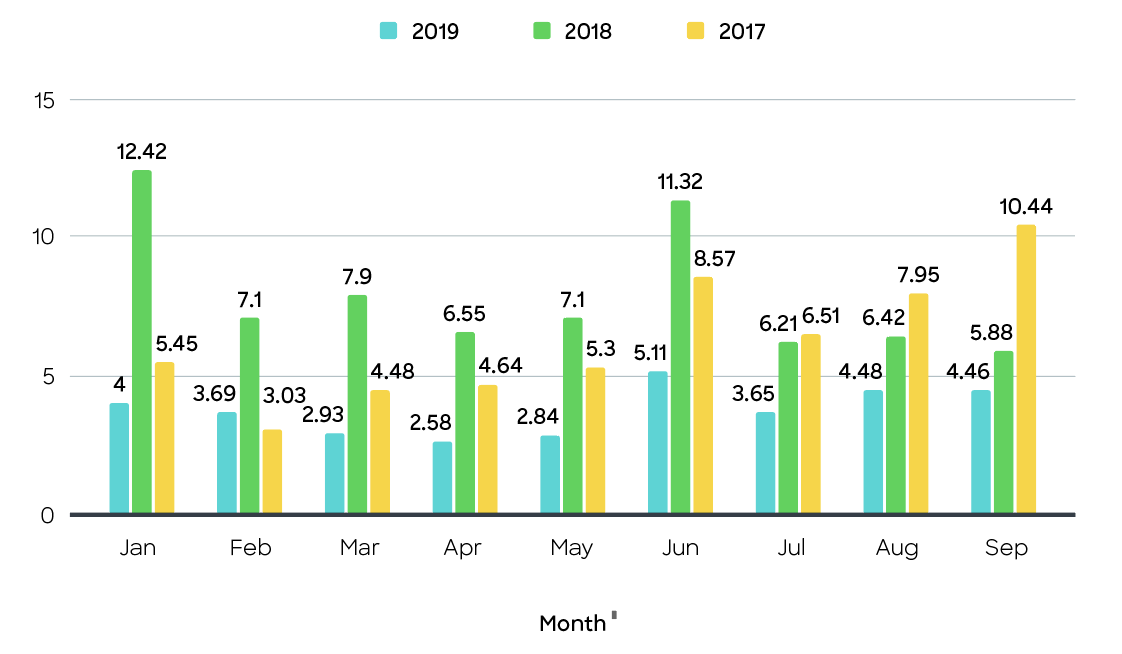
In the third quarter, reefer capacity was tighter than what was previously seen in Q2, hovering between 3.65 and 4.46 loads per truck, while still being significantly below the peak of 5.11 seen in June. According to DAT, harsh weather hurt harvests, kept rates from climbing, and caused some carriers to shift and compete for dry van loads. The moderate increase in September was largely due to the onset of apple harvest season. On the whole, Q3 reefer load-to-truck rations were nearly 25-60% lower than levels seen in 2018 and 2017.
DAT REEFER LOAD TO TRUCK RATIO
Rates
TRUCKLOAD LINEHAUL RATES INCREASE MONTH OVER MONTH DUE TO SEASONALITY WHILE STILL REMAINING LOWER THAN 2018 LEVELS
According to Cass Information Systems, truckload linehaul rates (without fuel) increased month over month by approximately 2.3% due to seasonality while remaining below the previous years levels. Both DAT and Cass show spot pricing continuing to be significantly lower than contracted rates and as such, will likely represent a larger percentage of the mix going into the fourth quarter.
CASS INFORMATION SYSTEMS TRUCKLOAD LINEHAUL INDEX
DRY VAN
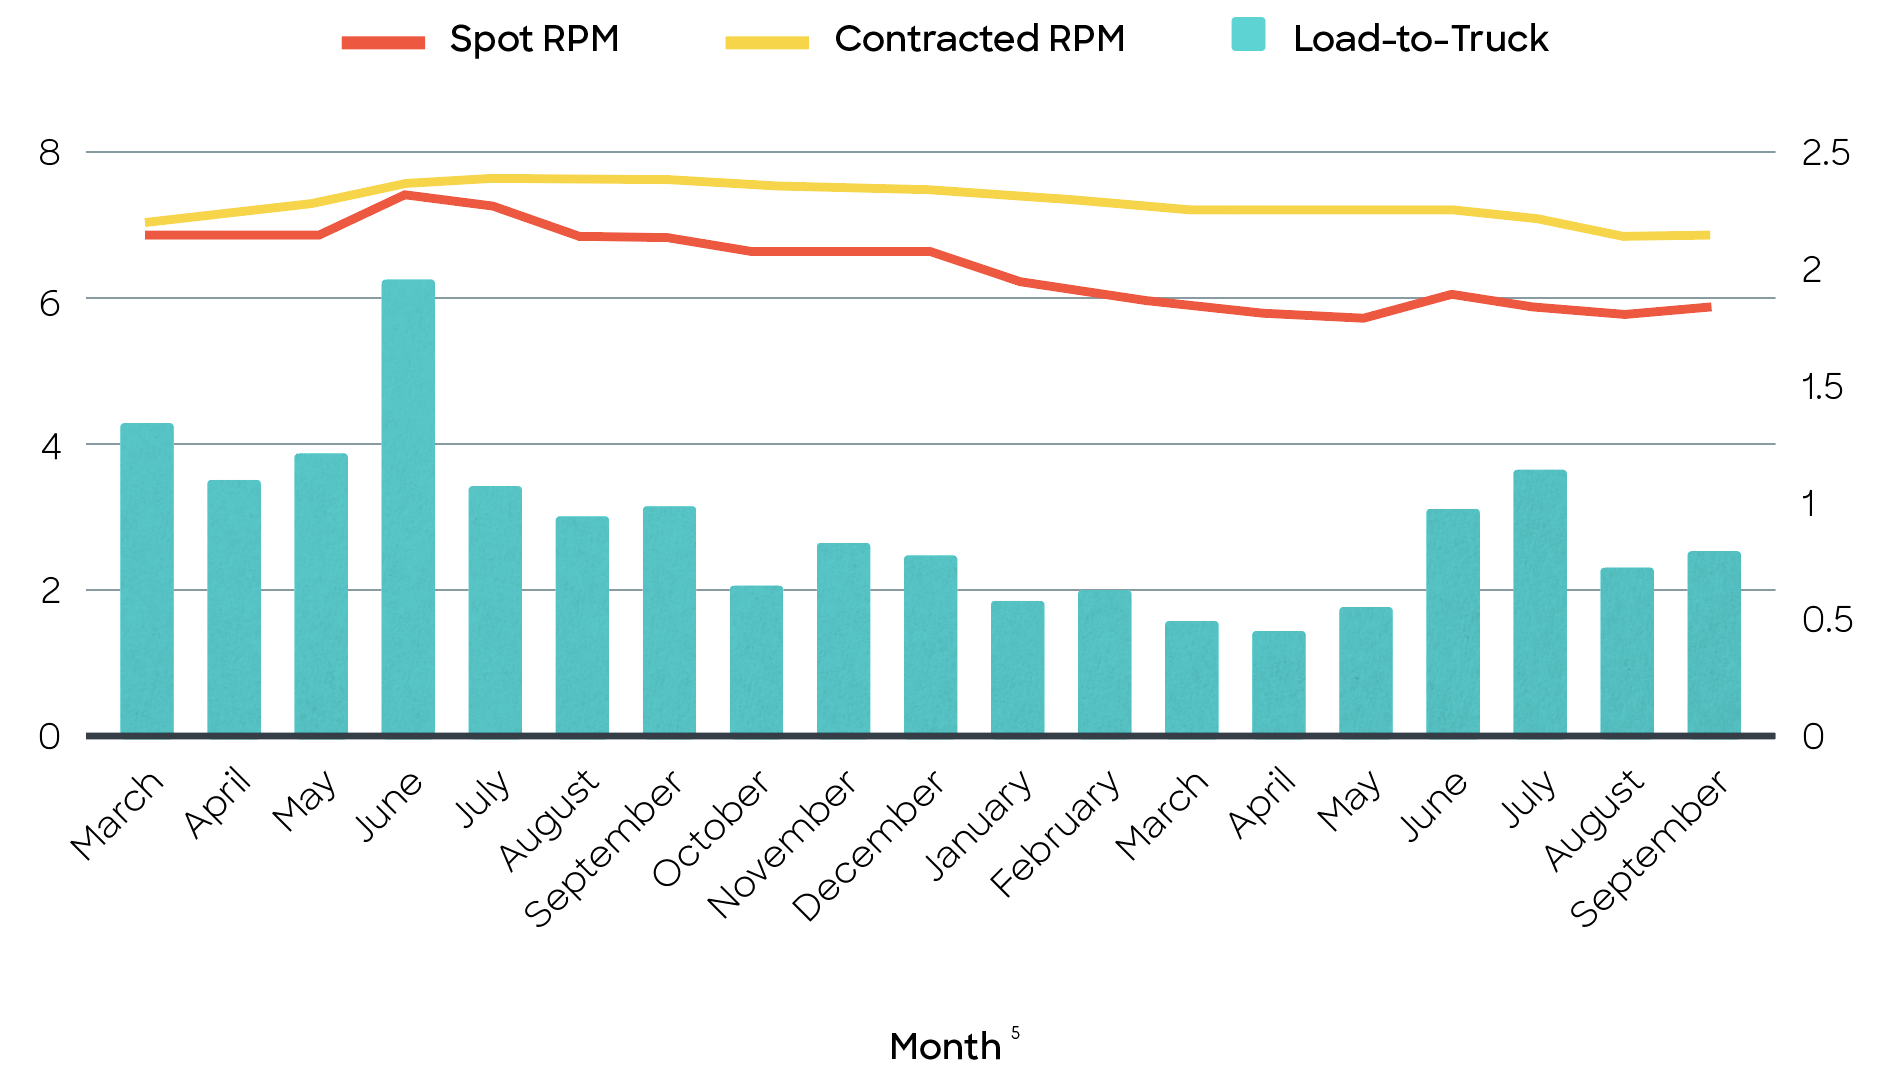
Van spot rates (including fuel), held relatively steady in Q3, hovering between $1.84 and $1.81 per mile, which is approximately 2-4% lower than the peak of $1.89 seen in June. Diesel prices had a slightly negative impact on rates in July and August, decreasing approximately 2%, before increasing by ~$0.10 (+2.7%) in September.
Contracted rates remained relatively stable through August, hovering at $2.24 per mile, before decreasing to $2.21 in September (-2.7%). There remains a 15-20% delta between spot and contracted rates. There remains a 15-20% delta between spot and contracted rates.
DAT VAN LOAD-TO-TRUCK, SPOT RPM AND CONTRACTED RPM
REEFER
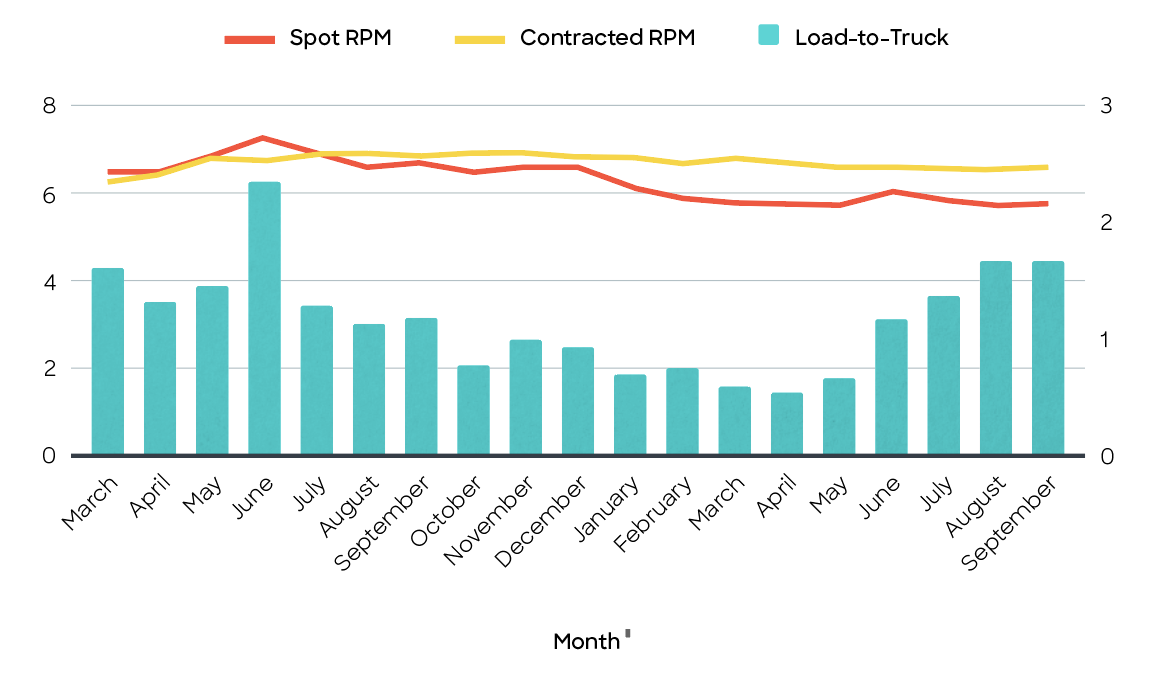
Reefer spot rates followed a similar trend to dry van. Spot prices remained between $2.18 and $2.16 per mile, while contracted rates hovered between $2.47 and $2.46 per mile. Like their dry van counterparts, spot remained significantly lower than contracted rates (12-14%).
DAT REEFER LOAD-TO-TRUCK, SPOT RPM AND CONTRACTED RPM
Fuel
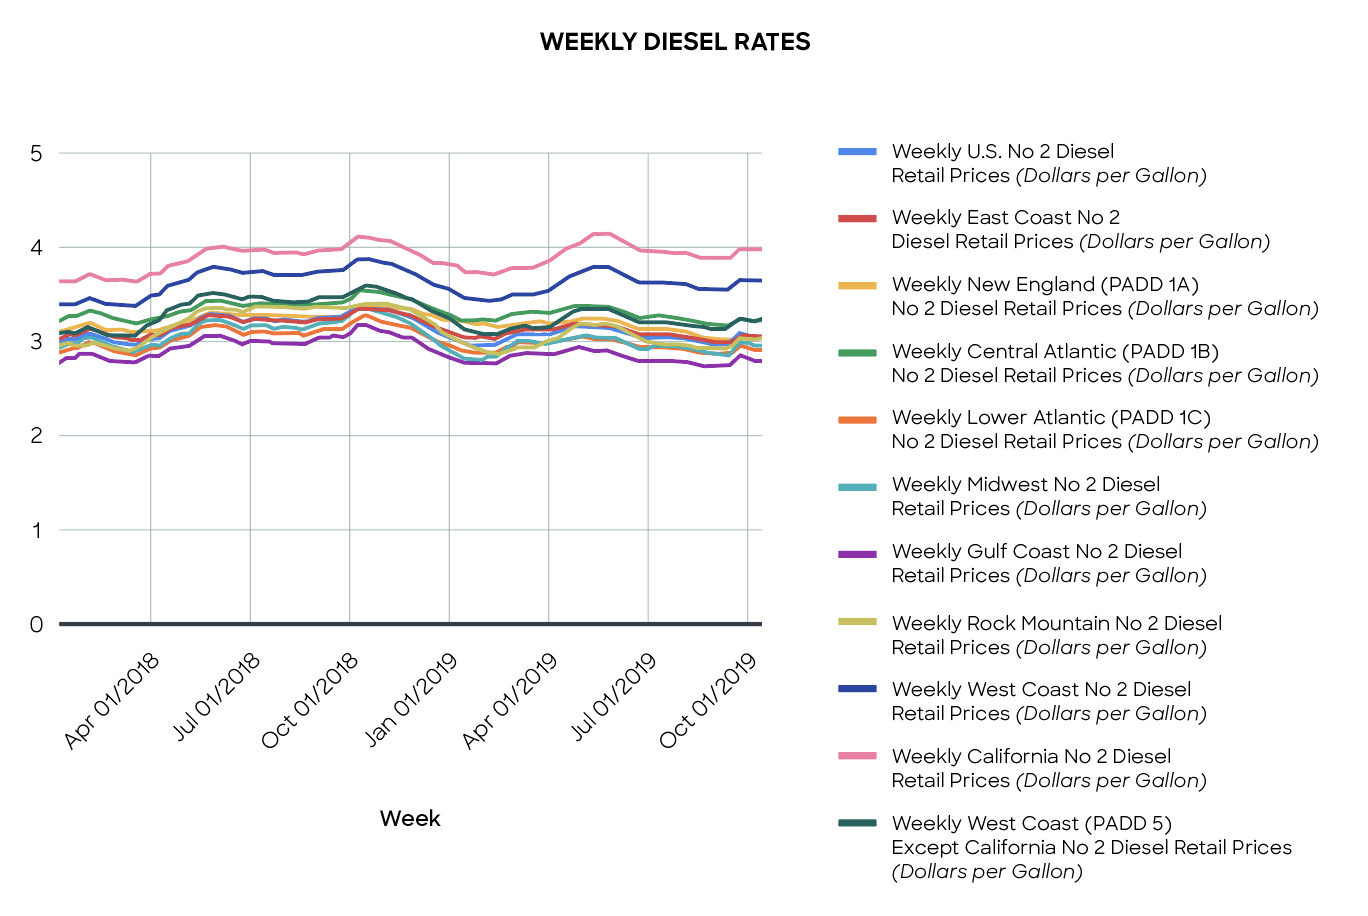
DIESEL PRICES DECREASE IN JULY AND AUGUST BEFORE MODERATELY INCREASING IN SEPTEMBER
Diesel prices remained neutral to negative in July and August before showing a 2.7% increase by late September, hovering just around $3.08 per gallon. Kiplinger, a leading publisher of business forecasts, predicts that diesel prices will not move dramatically higher or lower in the coming weeks.
Wrapping Up
With year over year freight volume declining for the tenth consecutive month, in addition to other economic indicators like the falling 10-year Treasury Yield and cracks in consumer sentiment, there’s reason for elevated concern.
Our take? These signals, when taken together, are indicative of an economic contraction. And while contraction is concerning, shippers have an opportunity to save in 2019 while capacity is high and spot rates remain significantly lower than other contracted options.
How Loadsmart Can Help
Loadsmart can help you take advantage of favorable market conditions by inserting real time rates alongside the static prices in your routing guide. This is made possible via direct integration with your TMS. In today’s market, there’s nearly a 20% gap between spot and contracted rates — savings which can be captured with Dynamic Routing.
Ready to Learn More?
Contact us at sales@loadsmart.com or (646) 887 6278. We look forward to working with you.
Materials in this presentation may contain information about Loadsmart Inc.’s future plans and prospects that constitute forward-looking statements for purposes of the safe harbor provisions under the Private Securities Litigation Reform Act of 1995. Included in forward looking statements are statements such as:
- Statements regarding market trends in the U.S. freight industry, including freight volume and pricing, market size and the state of transportation management systems;
Some forward-looking statements can also be identified by terminology such as “may,” “will,” “could,” “should,” “anticipate,” “believe,” “contemplate,” “estimate,” “expect,” “intend,” “plan,” “predict,” “project,” or similar words.
Such forward-looking statements are based on our current expectations and involve inherent risks and uncertainties, including factors that could delay, divert or change such statements, and could cause actual outcomes and results to differ materially from our current expectations. No forward-looking statement can be guaranteed. In evaluating forward-looking statements or forward-looking information, we caution readers not to place undue reliance on any forward-looking statement, and readers should specifically consider the various factors which could cause actual events or results to differ materially from those indicated by such forward-looking statements.
In addition, any information contained in this presentation was current as of the date presented and should not be relied upon as representing our estimates as of any subsequent date. While we may elect to update forward-looking statements at some point in the future, we specifically disclaim any obligation to do so, even if our estimates change, whether as a result of new information, future events or otherwise. Consequently, readers should not rely upon the information as current or accurate after the presentation date.