Share this
by jpallmerine
As usual, in this Monthly Market Update, we will provide a brief update & analysis of the full truckload market and present some compelling trucking-related economic analysis to provide a macroeconomic view on the state of the market.

Loadsmart's 2023 Truckload Market Outlook:
- As noted in previous updates, our spot market forecast predicted a Q4’23 spot rate rebound which would put us around +10%-15% up from today’s lows or +0-5% YoY. We’re currently refreshing this forecast with some more bearish assumptions that will likely push this rebound back to Q1’24 - Why?
- Demand indicators and the overall economic backdrop have worsened slightly.
- Most notably, Industrial Production for Q1’23 is likely to turn deflationary (YoY) for the first time in 3+ years and we expect consumption to remain flat or even decline amidst the continued high interest rate environment.
- The reduction in capacity is continuing to take longer than expected and we expect nothing different over the coming months due to:
- Excess carrier profits stemming from the historic bull market,
- Lower diesel rates YTD’23, and
- Simply the vast amount of excess trucks in the market today (we estimate 250k+)
- Contract rates are now down -15% YoY and we expect this number to get to -20-25% over the next two quarters based on our internal RFP pricing data (and as we all know contract inevitably follows spot
March 2023 Truckload Market Update:
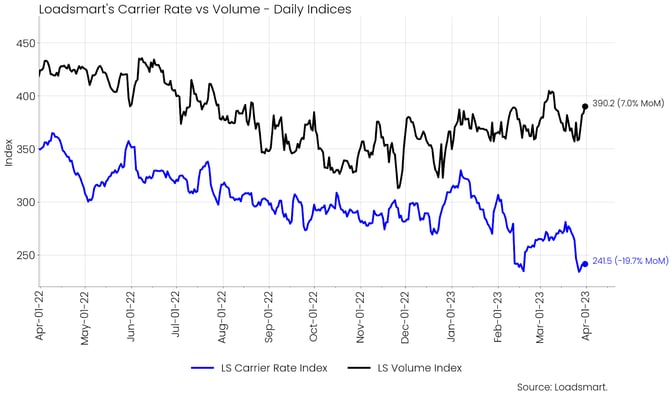
Figure 1
- Volumes: Our volume index increased by 3.5% in March (from day 01 to 31). The index was rather stable during the month. We continue to emphasize the positive recovery of our volume index. Our index rose for the fifth consecutive time in March on the monthly average and is only 5.2% down YoY. If this trend continues, our 2023 produce season should be busier than in the previous year.
- Rates: Our price index fell by 8.7% in March (day 01 to 31). From February 19th to March 24th, prices were on a steady recovery path, moving away from the February low. But by the end of the month, prices had plunged back to the same low point from February. This plunge was widespread across regions and was surprising given the timing with EOQ.
- We expect prices to remain low during March and early April during the transition from winter to spring until the demand for produce season picks up.
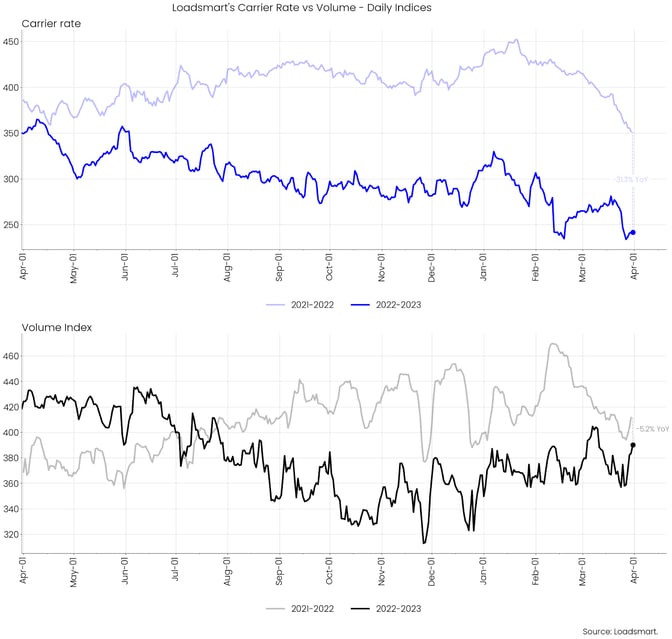
Figure 2
Freight & Economics
Credit constraints to weigh on consumer spending
- March marked the beginning of an unprecedented banking crisis that may weigh on consumer spending in the coming months. The failure of three US banks - Silvergate, Silicon Valley, and Signature - plus Credit Suisse has raised fears of a liquidity crunch in the financial system.
- This directly impacts banks' lending activity, so consumers can expect to see a deterioration in personal credit conditions in the months ahead.
- In this article from August 2022, we have already highlighted the slowdown in consumption and its effects on the freight market as inflationary pressures took their toll on the US economy.
- Now, a tightening of consumer credit can be an additional drag on individual spending, as the rise in loan rates and credit card fees will dampen credit-driven consumption.
- As Figure 3 shows, the loan prime rate (the rates that commercial banks charge their most creditworthy clients) has increased by 4.75 p.p. since March 2022 given Federal rate hikes. However, amidst a banking crisis, the spread between loan prime rates and Fed rates is expected to rise, pushing credit costs to a high similar to 2008.
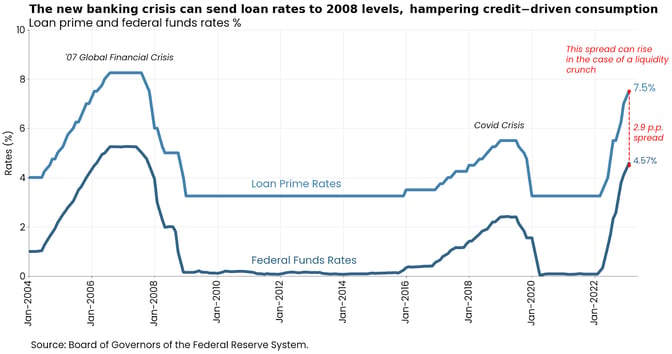
Figure 3
- Real consumption expending is down by 0.2% MoM, but up 1.5% YTD. As Figure 4 shows, only the service sector has kept steady growth since January 2022; while nondurables spending is stagnant, and durables spending plummeted in 2022. In January 2023, durables spending rebounded due to auto sales but decreased again in February.
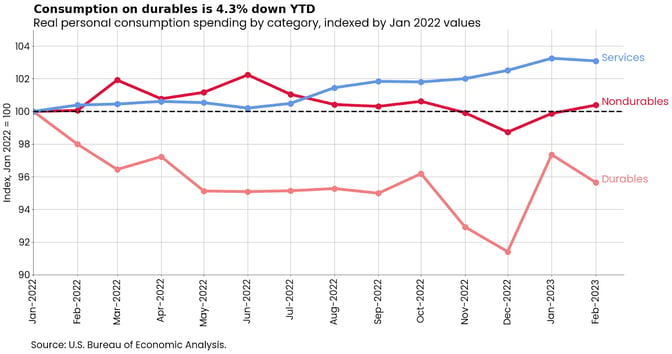
Figure 4
Opec+ surprise production cut to send diesel prices up
- On April 2nd, Opec announced a production cut that will begin in May and run until the end of 2023. The cut came as a surprise to the US administration, which has been trying to lower fuel prices in order to control domestic inflation and ease the dependence on OPEC+ decisions.
- The US government has been controlling the oil supply in its territory through the use of the Strategic Petroleum Reserve (SPR). However, the SPR may not be able to offset the effect of this unexpected production cut by OPEC+ members because it is unable to increase its oil production in the short term.
- It is still unclear how much of the OPEC+ decision will be passed on to retail diesel prices, but we expect an upward revision to the price forecasts from the latest EIA report - shown in Figure 5.
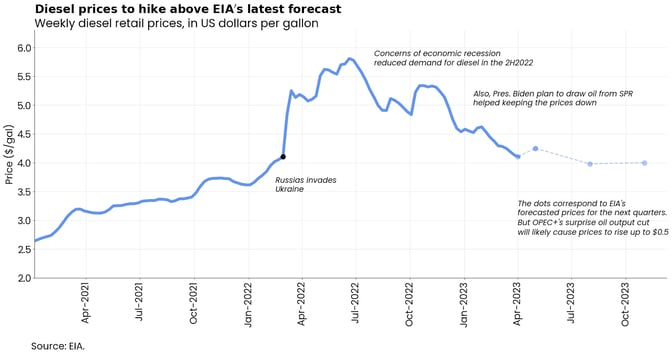
Figure 5
- Fuel prices were already projected to increase slightly over the summer, and the OPEC announcement will contribute further. However, the effect should be small and it is unlikely that prices will reach 2022 levels and exceed $5 per gal - read more here.
—------------------------------------------------------------------------------------------
Please reach out to Stella Carneiro (stella.carneiro@loadsmart.com) with any questions, suggestions, thoughts, etc. Thank you! We hope you enjoy! #movemorewithless
For more about how you can understand the current market to plan for the future, download our quarterly report.